

How to Review Your Sessions with Awesome Golf Insights
4 min read
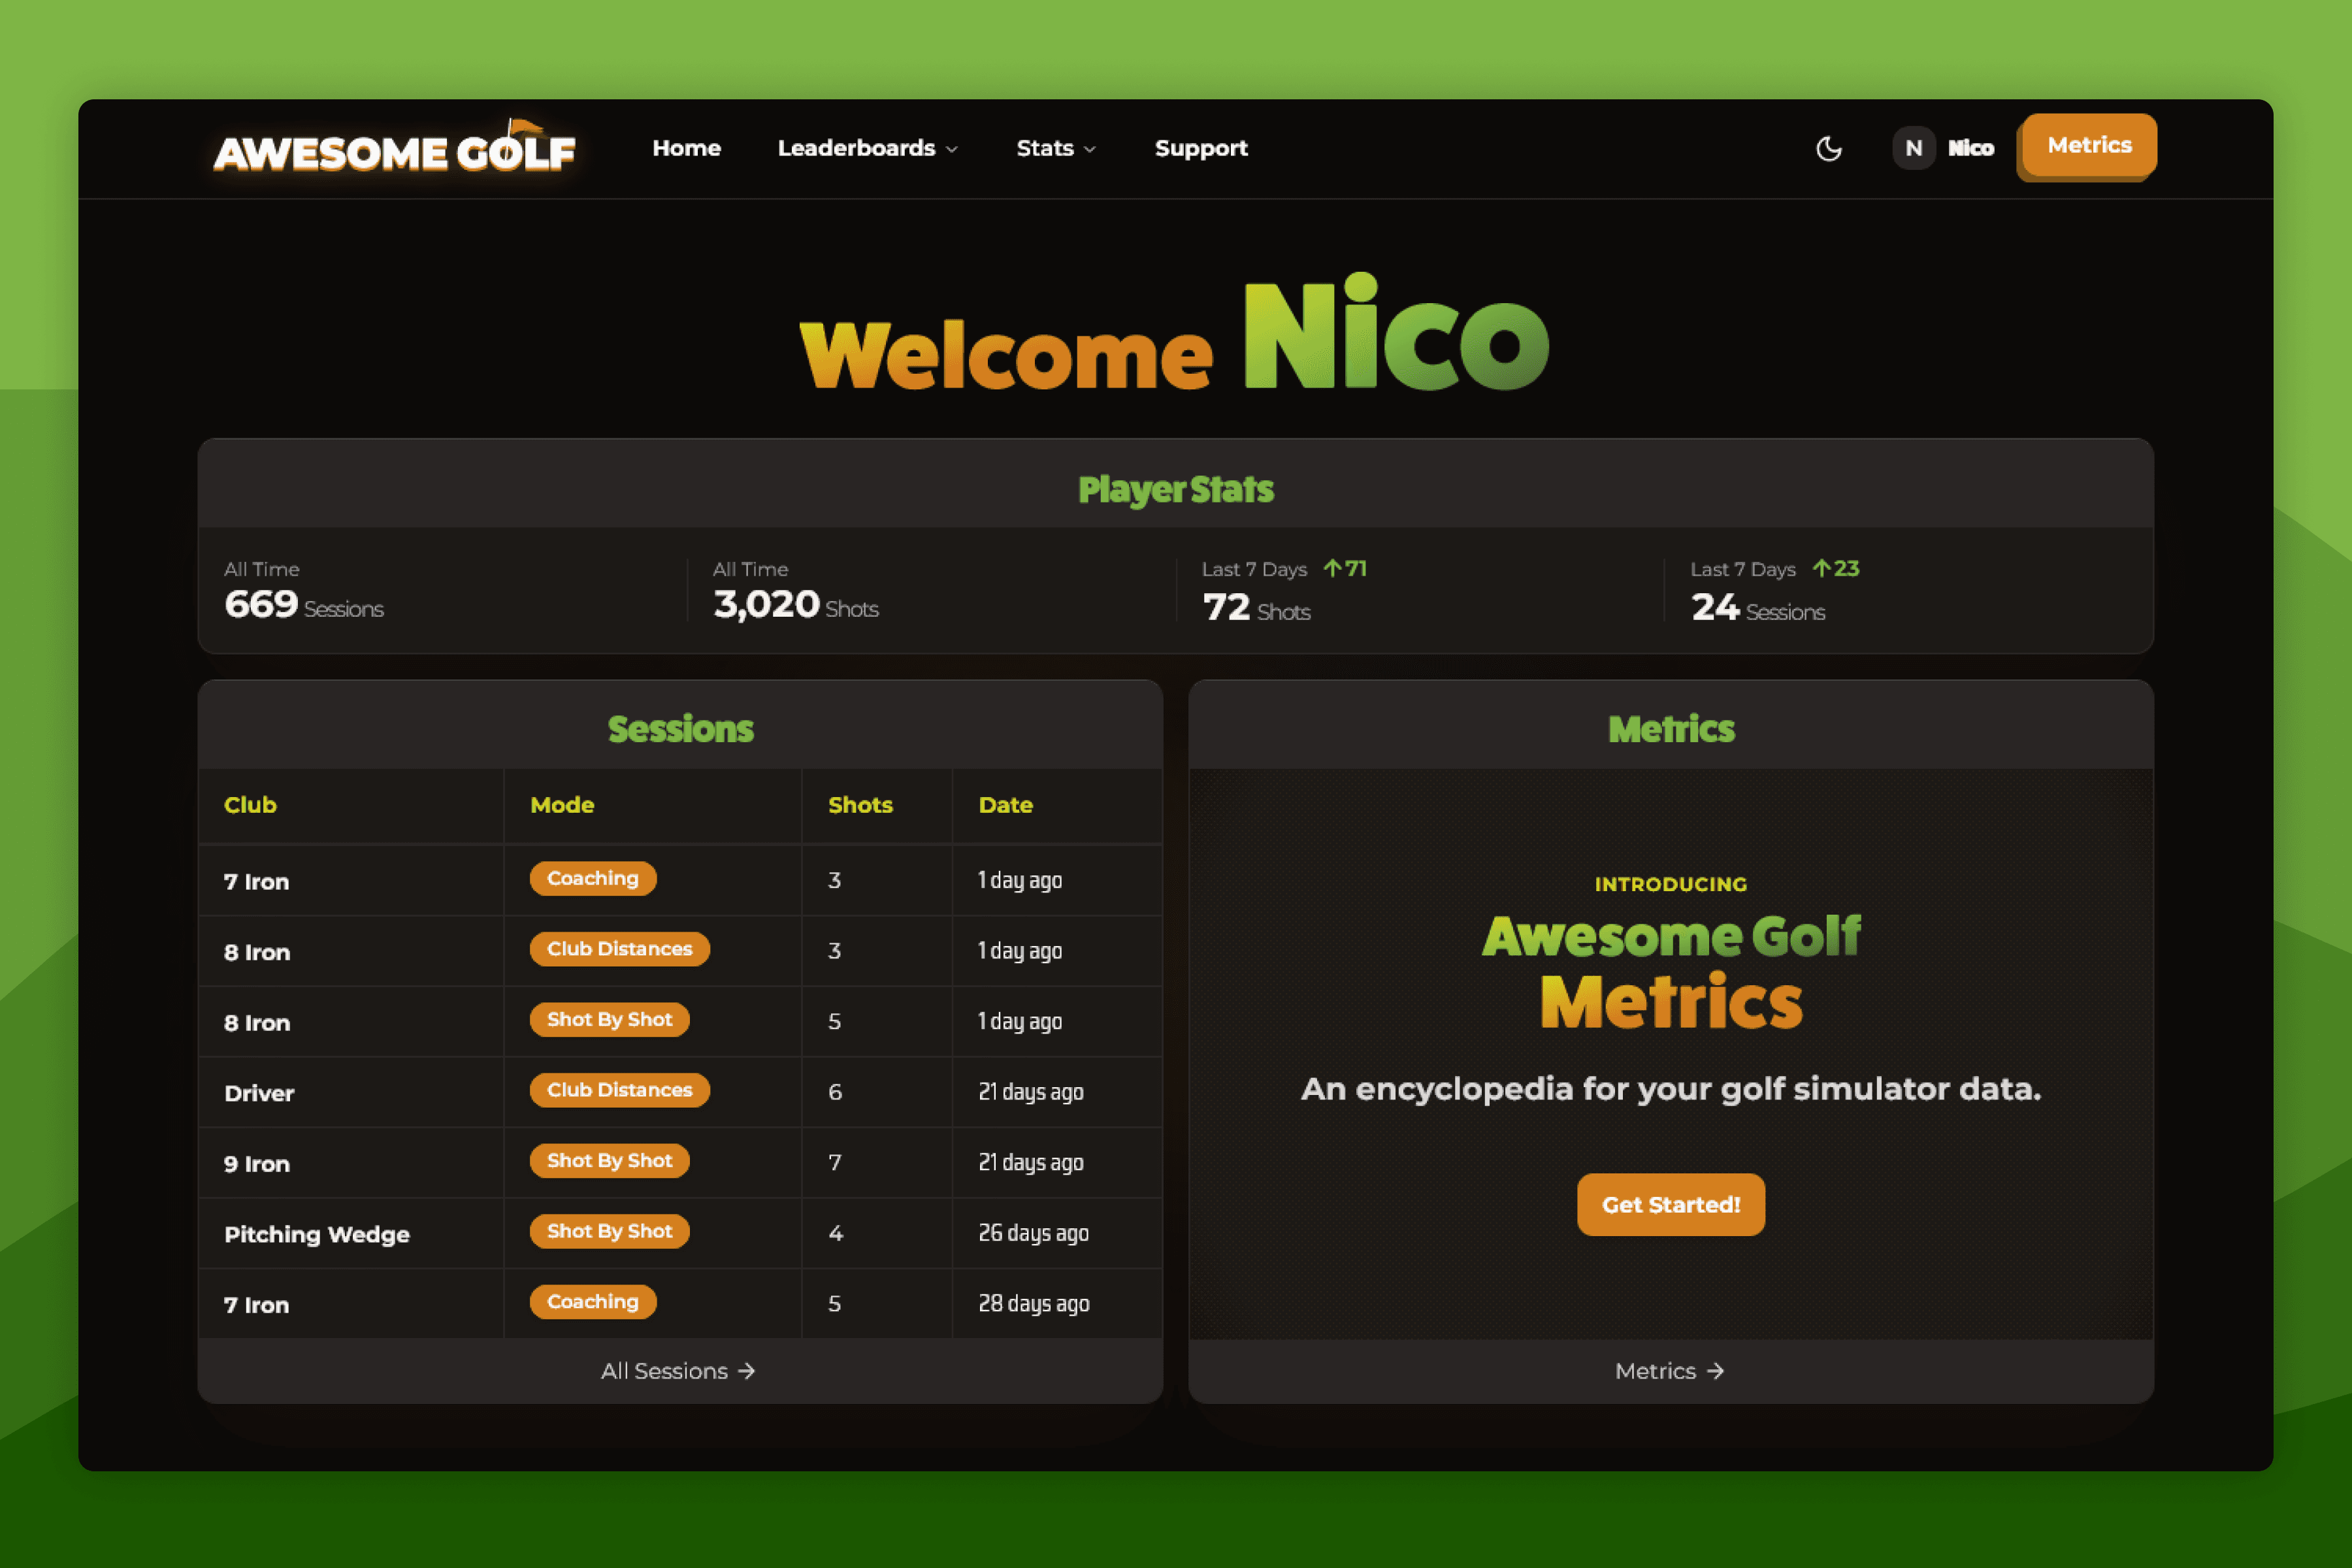
Once you've played a session of Shot by Shot, Coaching, or Club Distances in Awesome Golf Simulator, you'll be able to review your stats and performance for the game using Awesome Golf Insights.
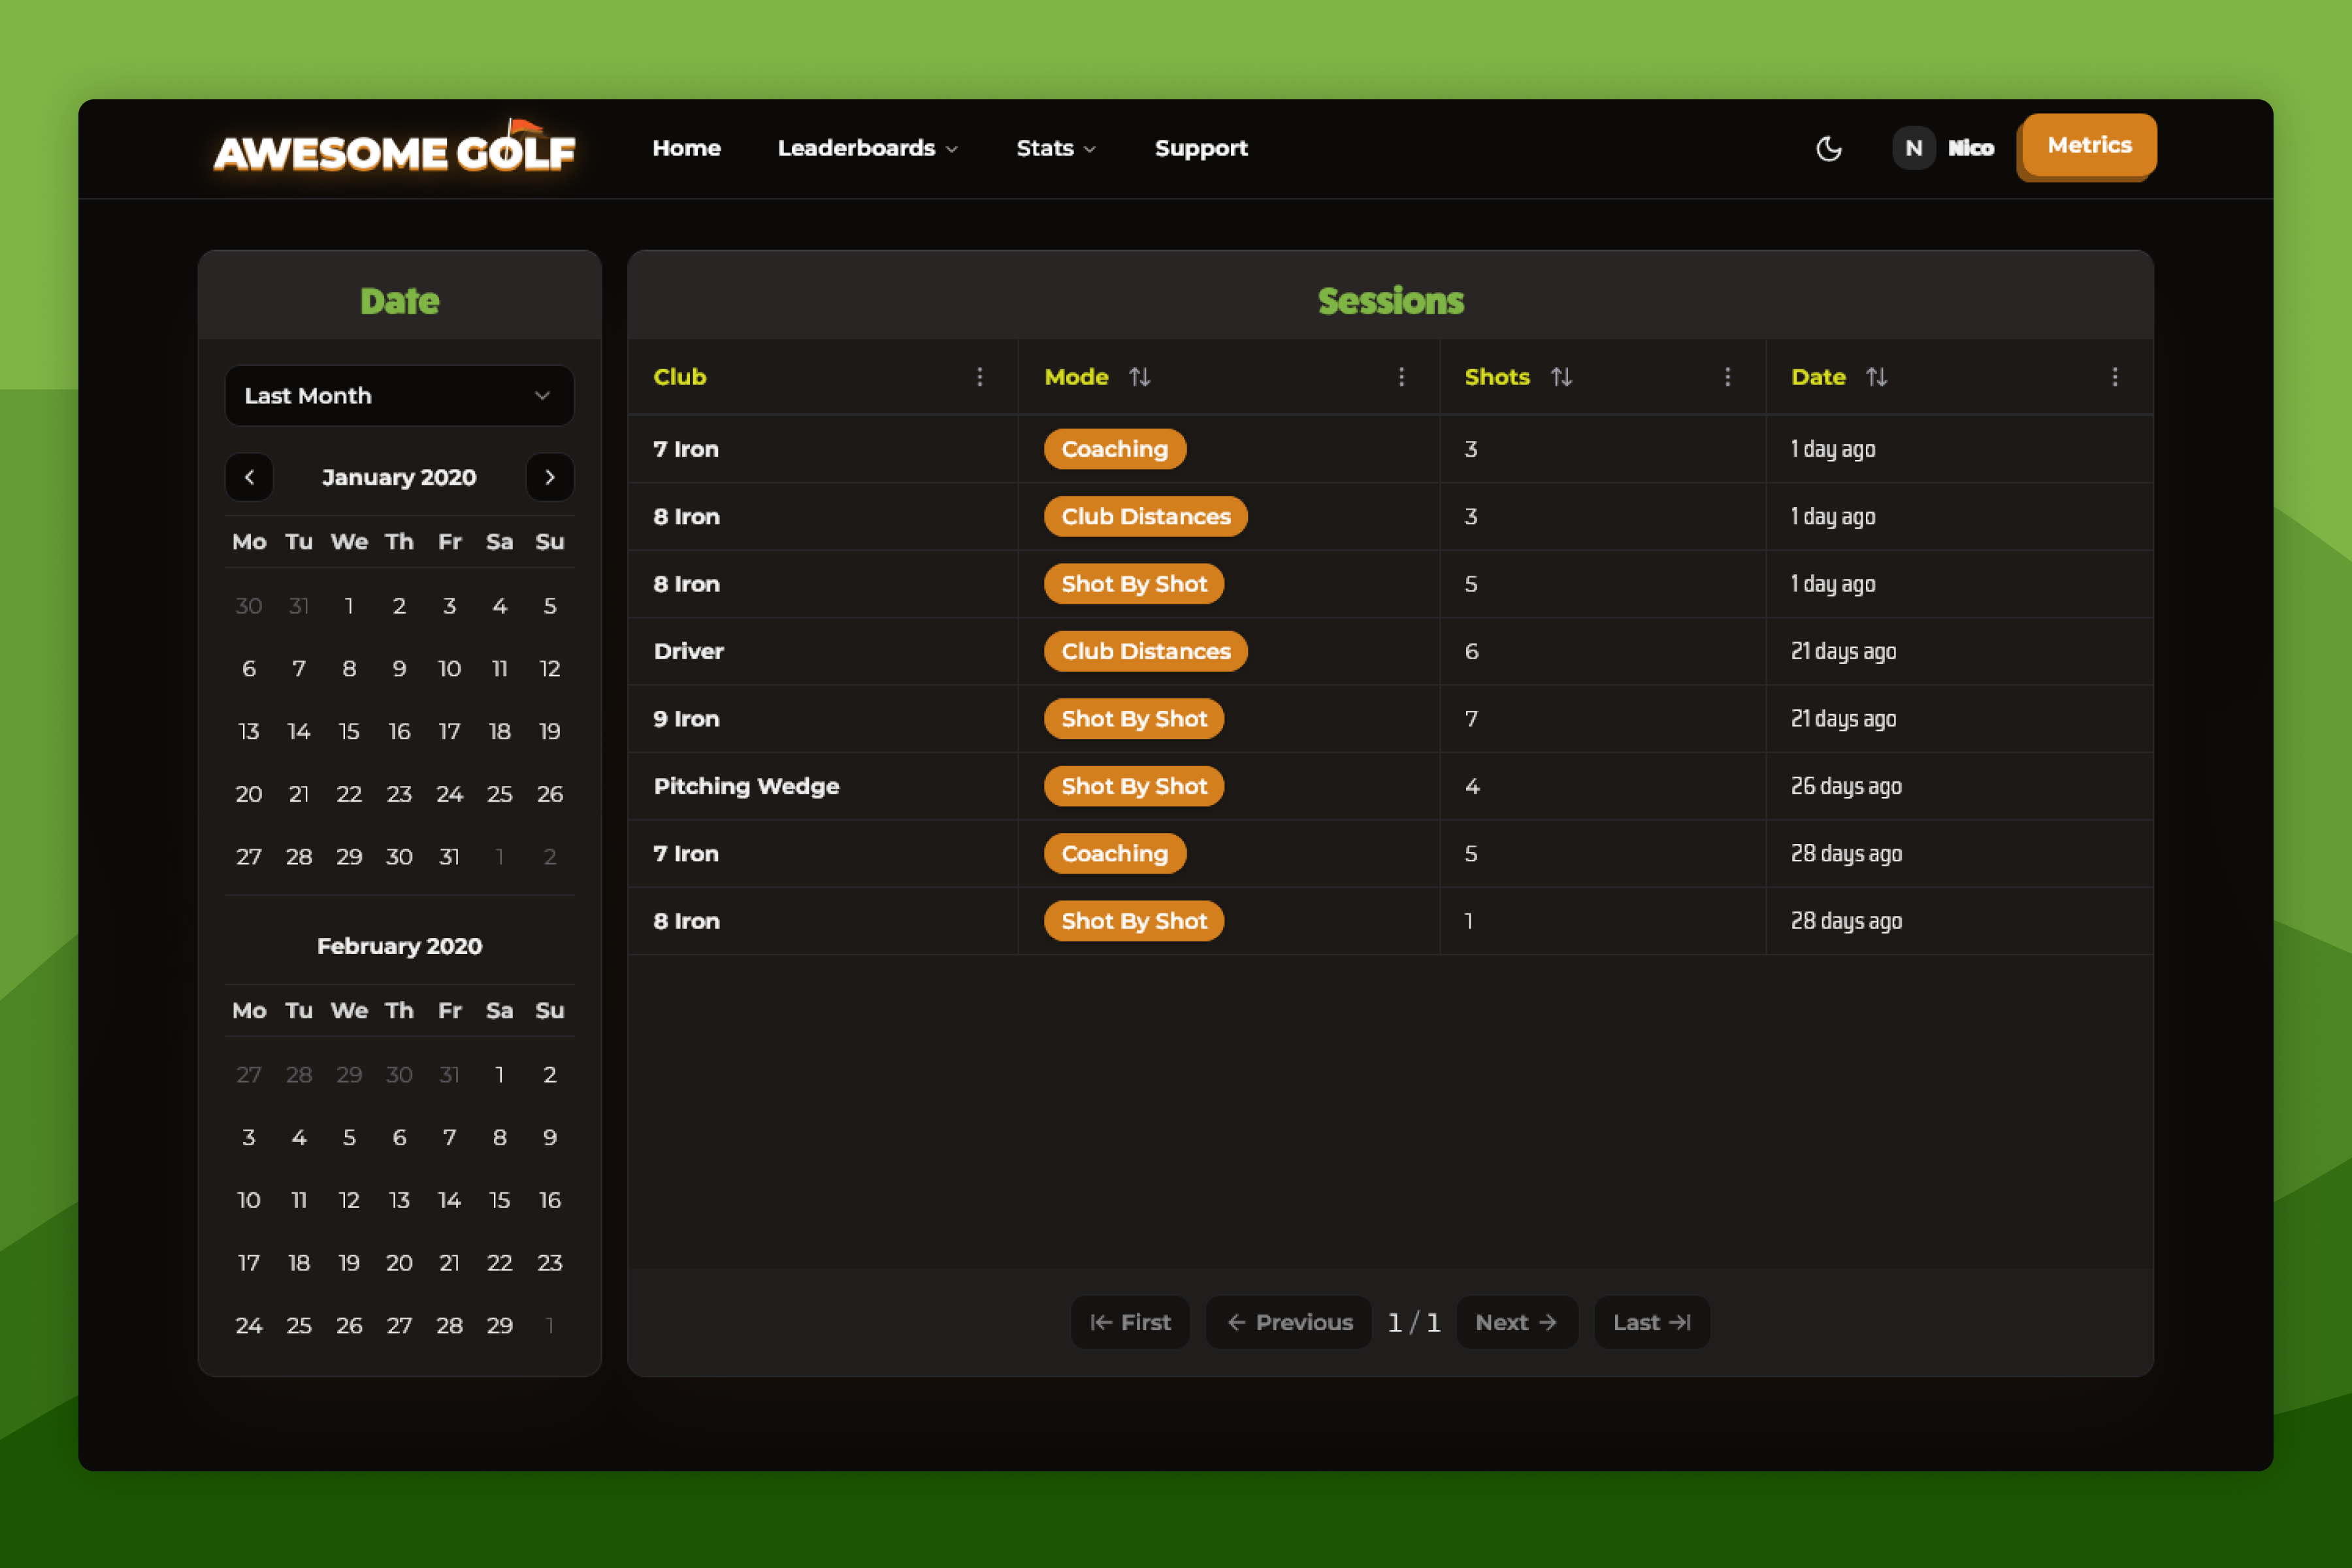
To see a list of your recent sessions, or filter by date to find a specific session, go to insights.awesome-golf.com/sessions, or select Stats in the navigation bar, then select Sessions in the dropdown dialogue. From this list of sessions, selecting one will open up all of the details and metrics for the session.
From the Filters panel on the left-hand side, you can filter the list of sessions by Dates and Clubs, sort them from the menu above the list (for example Newest first or Most shots), and switch between Cards and Table. If you have a lot of previous sessions, select Show older sessions at the bottom of the list to load 12 more at a time.
With a session selected, you can analyse and review the data metrics from your Awesome Golf practice session. The session detail screen shows analysis and visualisation of your metrics in an individual session, with averages and standard deviations for the session's data points.
Session Overview
At the top of the session detail page, you'll see an overview of the session, with details about the club used in the session, the club's text description, the game mode the shots were hit in, and the date and time that the session was played. Selecting the edit (✏️) icon next to the Club or Description will allow you to update or rename those fields.
Additionally, in the top-right corner of the page, you'll find an Export CSV button to download the session's shot stats as a CSV file in your browser, and a Delete session button.
Session Shots
Below the session overview, you'll see a table view of the shots from this session, sorted from oldest to most recent. For each shot you'll see a selection of the data points and metrics for the shot - and selecting the metric's heading in the table will allow you to sort the shots by that metric. Additionally, at the bottom of the table, you'll see Deviation (standard deviation) and Average rows for the shots in the table.
By default, this table will only show a selection of the available data metrics for each shot, however, different data points can also be displayed in this table by selecting the settings cog (⚙️) at the top right of the Shots table and showing or hiding columns in Table settings (drag a column to reorder it).
Selecting the question mark (❔) icon next to a data metric's title will show a quick description of the data metric, with a Show Full Definition link to open up more key info on the metric from Awesome Golf Metrics in a dialogue. Columns can also be resized by dragging the divider between columns horizontally. Additionally, selecting and dragging the handle at the bottom will allow you to resize the rows.
Selecting one or more rows in the session shots table will highlight them and update the Average and Deviation rows and the analysis below to display the selected shots only. With multiple shots selected, you'll be able to remove the selected shots by selecting the shots, then selecting Delete shots above the table. Alternatively, individual shots can be deleted from the session by selecting the red bin icon (🗑️) on the right-hand side of the row. Deleted shots and sessions cannot be recovered after deletion.
Session Visualisations and Averages
Below the Shots table, the session's shots, or your selected shots, are shown in the Dispersion outfield, grouped in an oval to show distance, accuracy and consistency, alongside Face impact, Face to path, Dynamic loft and Spin axis. The Speed & distance, Launch & flight and Spin & delivery cards show each metric's average and standard deviation.
Share this page
Related guides
 ReferenceAwesome Golf InsightsAwesome Golf Insights provides the tools needed to improve your golf performance and analyse your game as you improve. Review your stats, data points, and metrics for all of your recent sessions; see detailed analysis of the metrics tracked during your practice sessions; compare your performance with different clubs, identifying gaps in your distances; and tracking your Awesome Golf leaderboard performance - and your competition entries.
 How-To GuidesReview Your StatsAlongside your Awesome Golf Simulator experience we have a number of ways that you can review your shots and stats.
- ReferenceApp ComparisonIn addition to the core game, Awesome Golf Simulator, we offer Awesome Golf Insights to help you review your status, Awesome Golf Assistant as a utility to help you connect Launch Monitors that don't support direct connections, and Awesome Golf Community to let users use Quick QR-Login at Driving Ranges and Indoor Facilities.
Still need help?
- Contact supportLive chat, WhatsApp or email
- Ask the communityAwesome Golf Facebook group
- Search the docsFind another guide
New to Awesome Golf? Start a free trial or view pricing.