Awesome Golf Insights
Awesome Golf Insights is our analysis tool for reviewing your Awesome Golf stats, comparing club metrics, measuring your performance to help you improve, and seeing your progress through Coaching sessions.
Awesome Golf Insights provides the tools needed to improve your golf performance and analyse your game as you improve. Review your stats, data points, and metrics for all of your recent sessions; see detailed analysis of the metrics tracked during your practice sessions; compare your performance with different clubs, identifying gaps in your distances; and tracking your Awesome Golf leaderboard performance - and your competition entries.
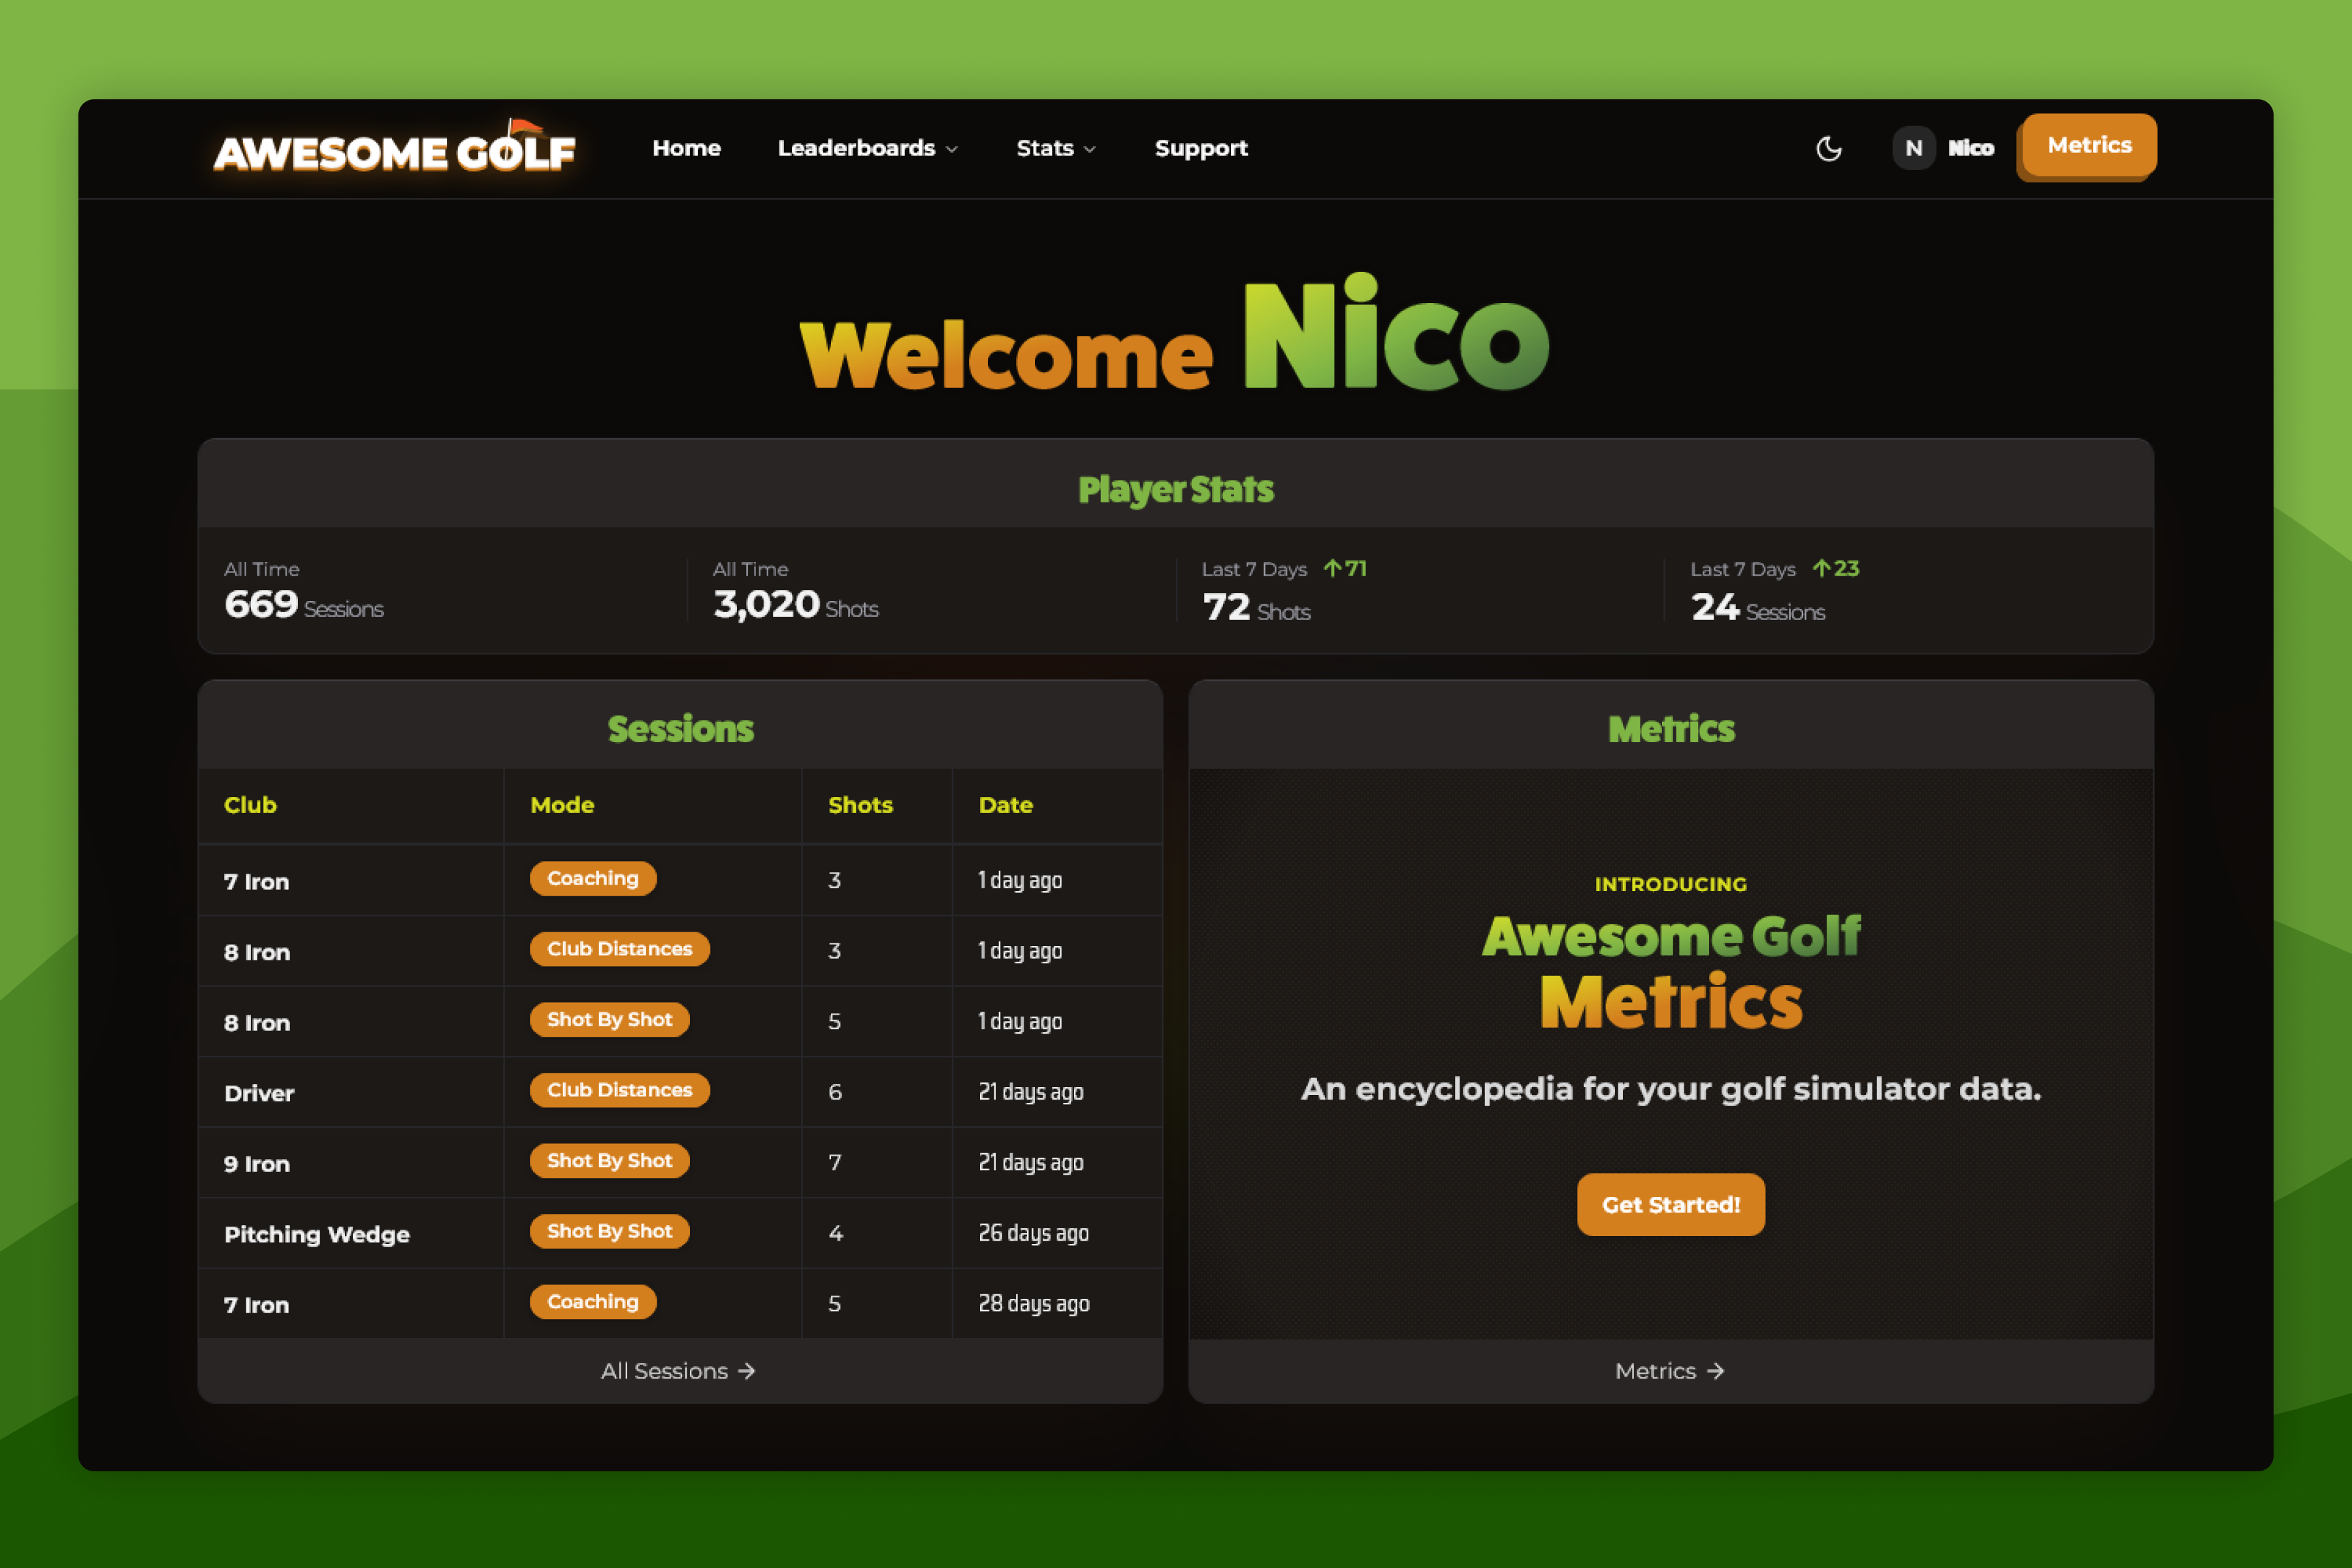
Dashboard
From the Awesome Golf Insights Dashboard, you can view your lifetime player stats as well as the number of shots and sessions for the past week at a glance - it also gives quick access to Awesome Golf Metrics, the encyclopaedia for all the terms featured in Awesome Golf Simulator.
Sessions shows a chronological list of the clubs used and the number of shots hit on your most recent sessions in Shot by Shot, Coaching, and Club Distances practice modes. Selecting a specific session will show a full analysis of the shots with the selected club in a particular session. More, and older, sessions can also be seen and searched through by selecting All Sessions at the bottom of the list.
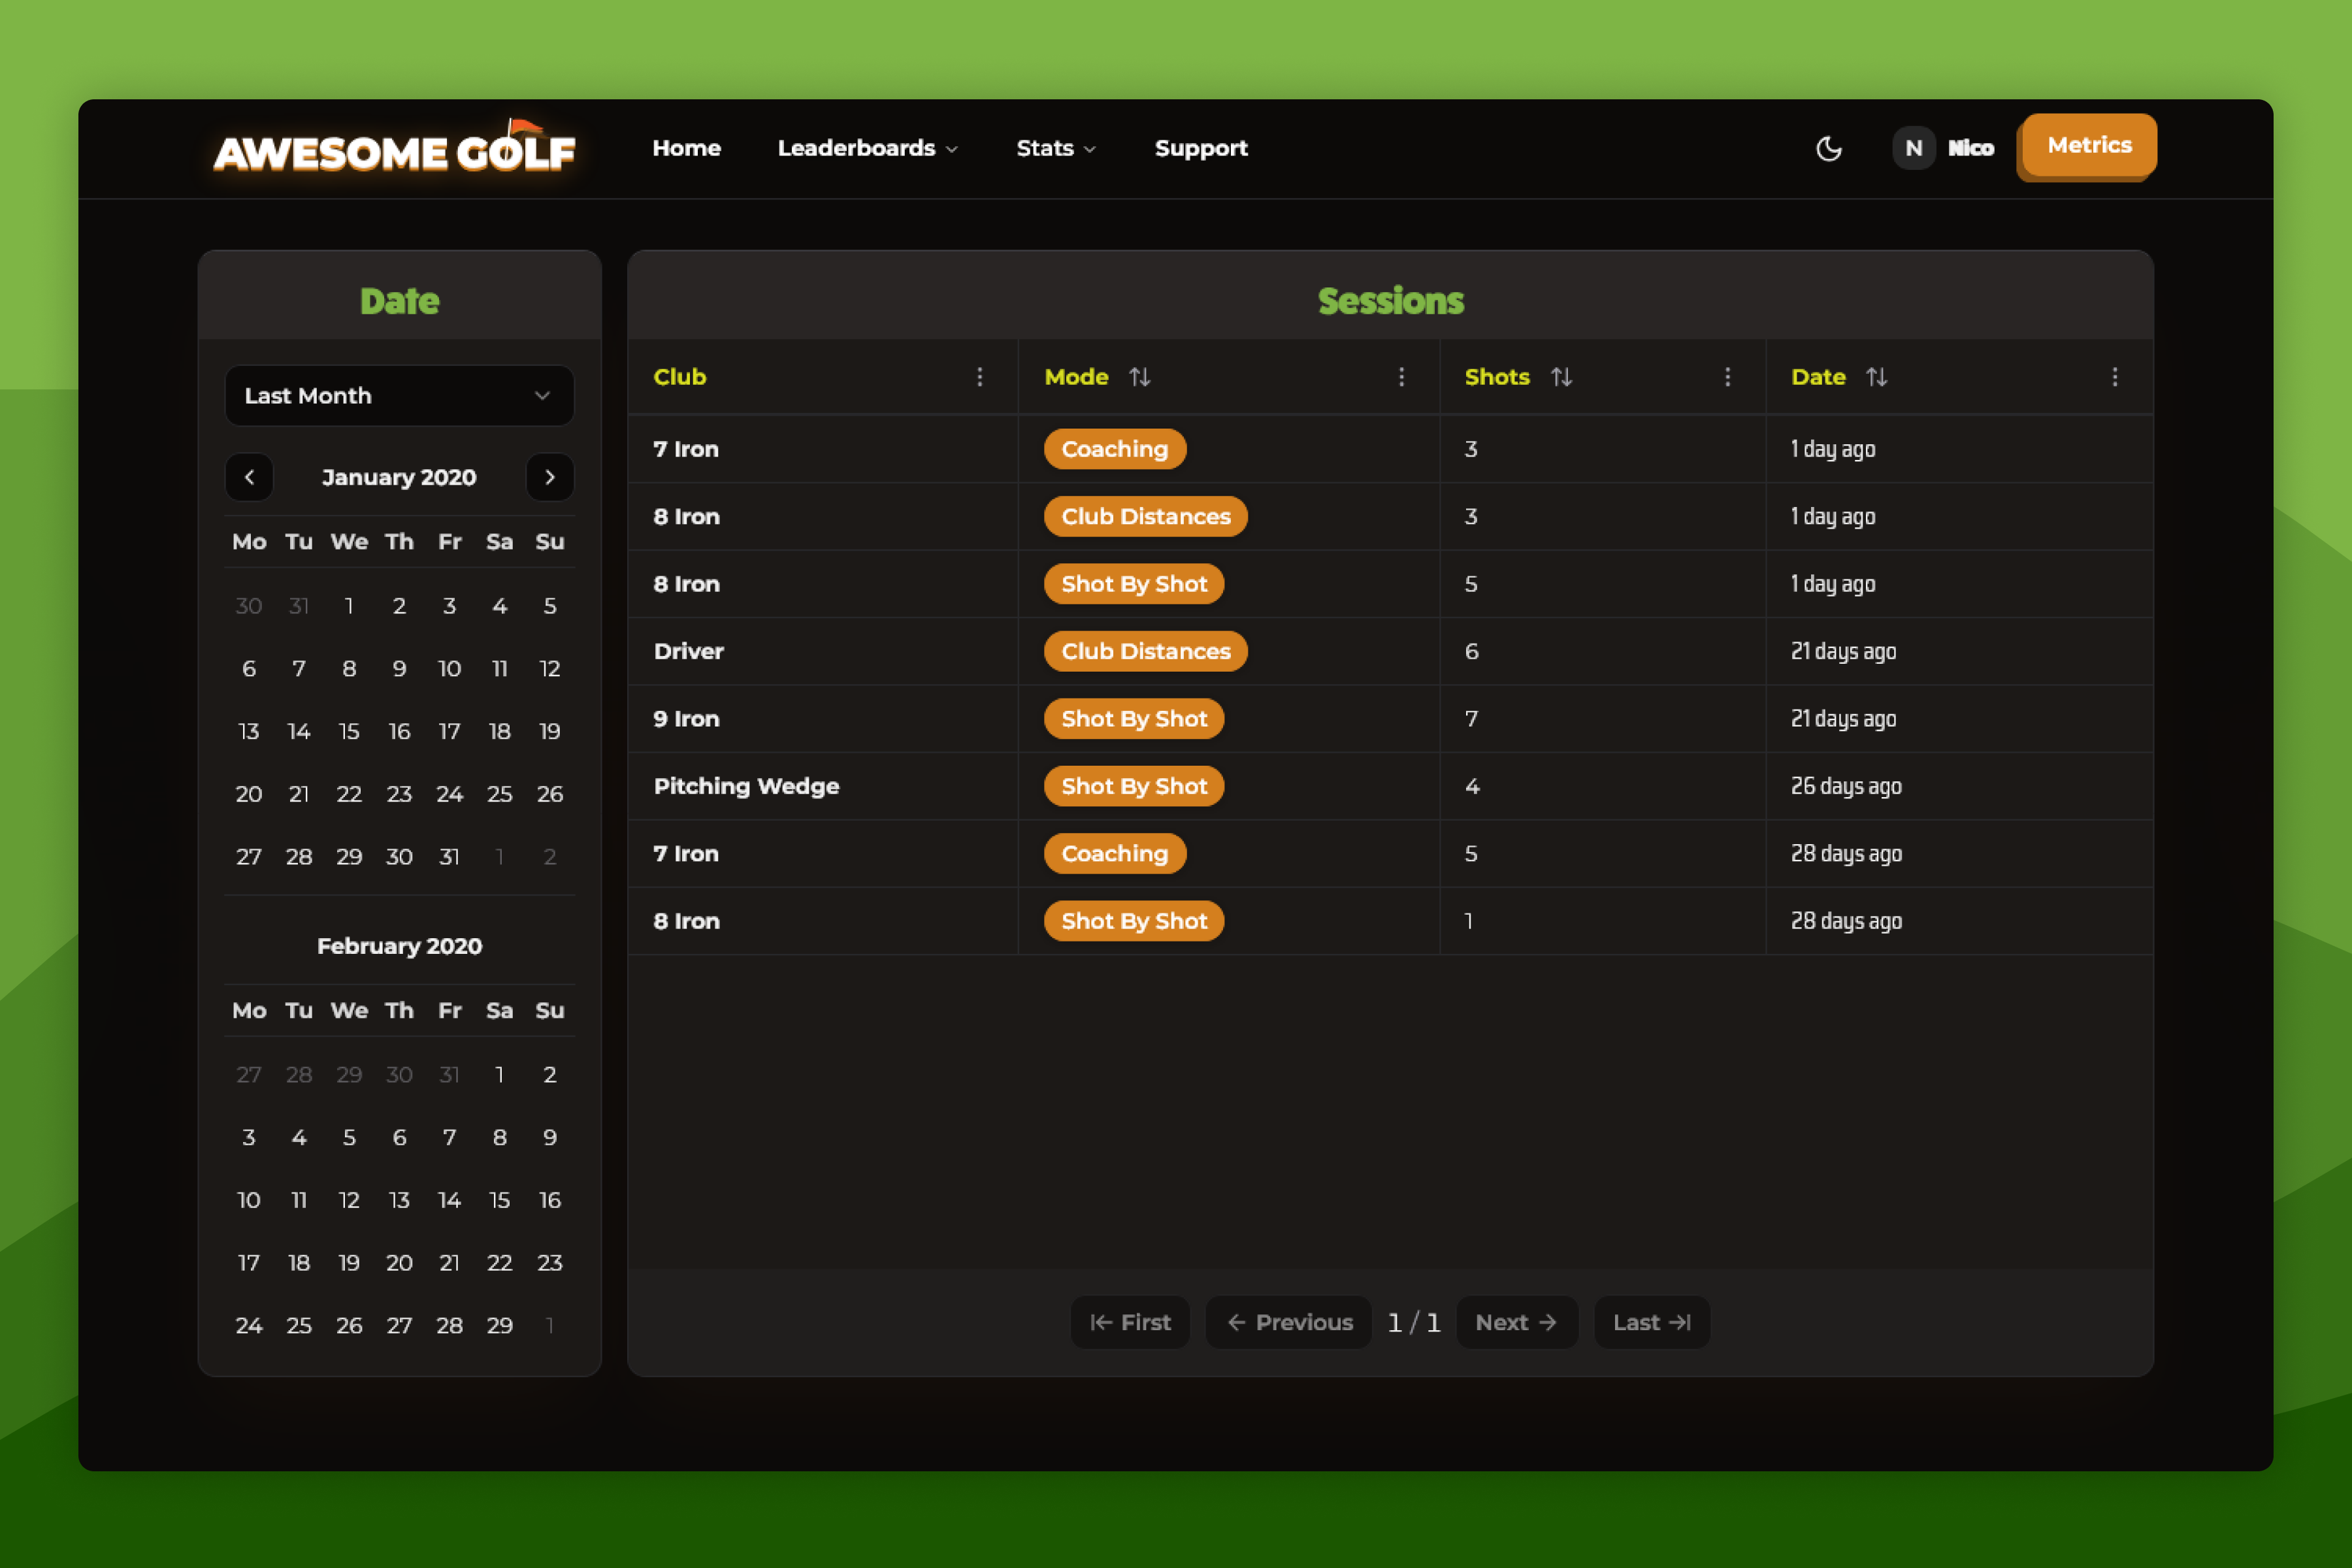
Sessions List
From the full Sessions List in Awesome Golf Insights, you can search through all of your previous practice sessions in Awesome Golf Simulator in the Shot by Shot, Coaching, and Club Distances, practice game modes.
Selecting a session from the list will show the session in more detail, including analysis and visualisation of your metrics within the session. This will also show you a list of the shots in the session and remove them if necessary, for outliers.
From the sidebar on the left-hand side, you can filter the list of sessions by time, and sort the results by selecting the arrows in each of the list's column headings. Additionally, if you have a lot of previous sessions, at the bottom of the list the Next / Previous buttons will allow you to step through pages of 10 sessions at a time.
Session Detail
Sessions in Awesome Golf Insights allow you to revisit practice sessions from Awesome Golf: Simulator, Indoor Facilities, and Ranges. The session detail screen shows analysis and visualisation of your metrics in an individual session, with a section for Total Averages for the session's data points.
At the top of the session detail page, you'll see an overview of the session, with details about the club used in the session, the club's text description, the game mode the shots were hit in, and the date and time that the session was played. Selecting the edit (✏️) icon next to the Club or Description will allow you to update or rename those fields.
Additionally, in the top-right corner of the page, you'll find a small ... (ellipsis) button that will open a set of options to allow you to Delete Session, or Export CSV to download the session's shot stats as a CSV file in your browser.
Session Shots
Below the session overview, you'll see a table view of the shots from this session, sorted from oldest to most recent. For each shot you'll see a selection of the data points and metrics for the shot - and selecting the metric's heading in the table will allow you to sort the shots by that metric. Additionally, at the bottom the table, you'll see a row for Averages and Standard deviation for the shots in the table.
By default, this table will only show a selection of the available data metrics for each shot, however, different data points can also be displayed in this table by selecting the settings cog (⚙️) on the right-hand side of the table and toggling the display of different metrics' columns.
Hovering over the ? (question mark) icon in a next to a data metric's title will show a quick description of the data metric, with a Show Full Definition link to open up more key info on the metric from Awesome Golf Metrics in a dialogue. Columns can also be resized by dragging the divider between columns horizontally. Additionally, selecting and dragging the handle at the bottom will allow you to resize the rows.
Selecting one or more rows in the session shots table will highlight them and update the Averages, Standard Deviations, and Total Averages section, to display the analysis for the selected shots only. With multiple shots selected, you'll be able to remove the selected shots by selecting the shots, then selecting Delete X Shots at the top of the table. Alternatively, individual shots can be deleted from the session by selecting the red bin icon (🗑️) on the right-hand side of the row. Deleted shots and sessions cannot be recovered after deletion.
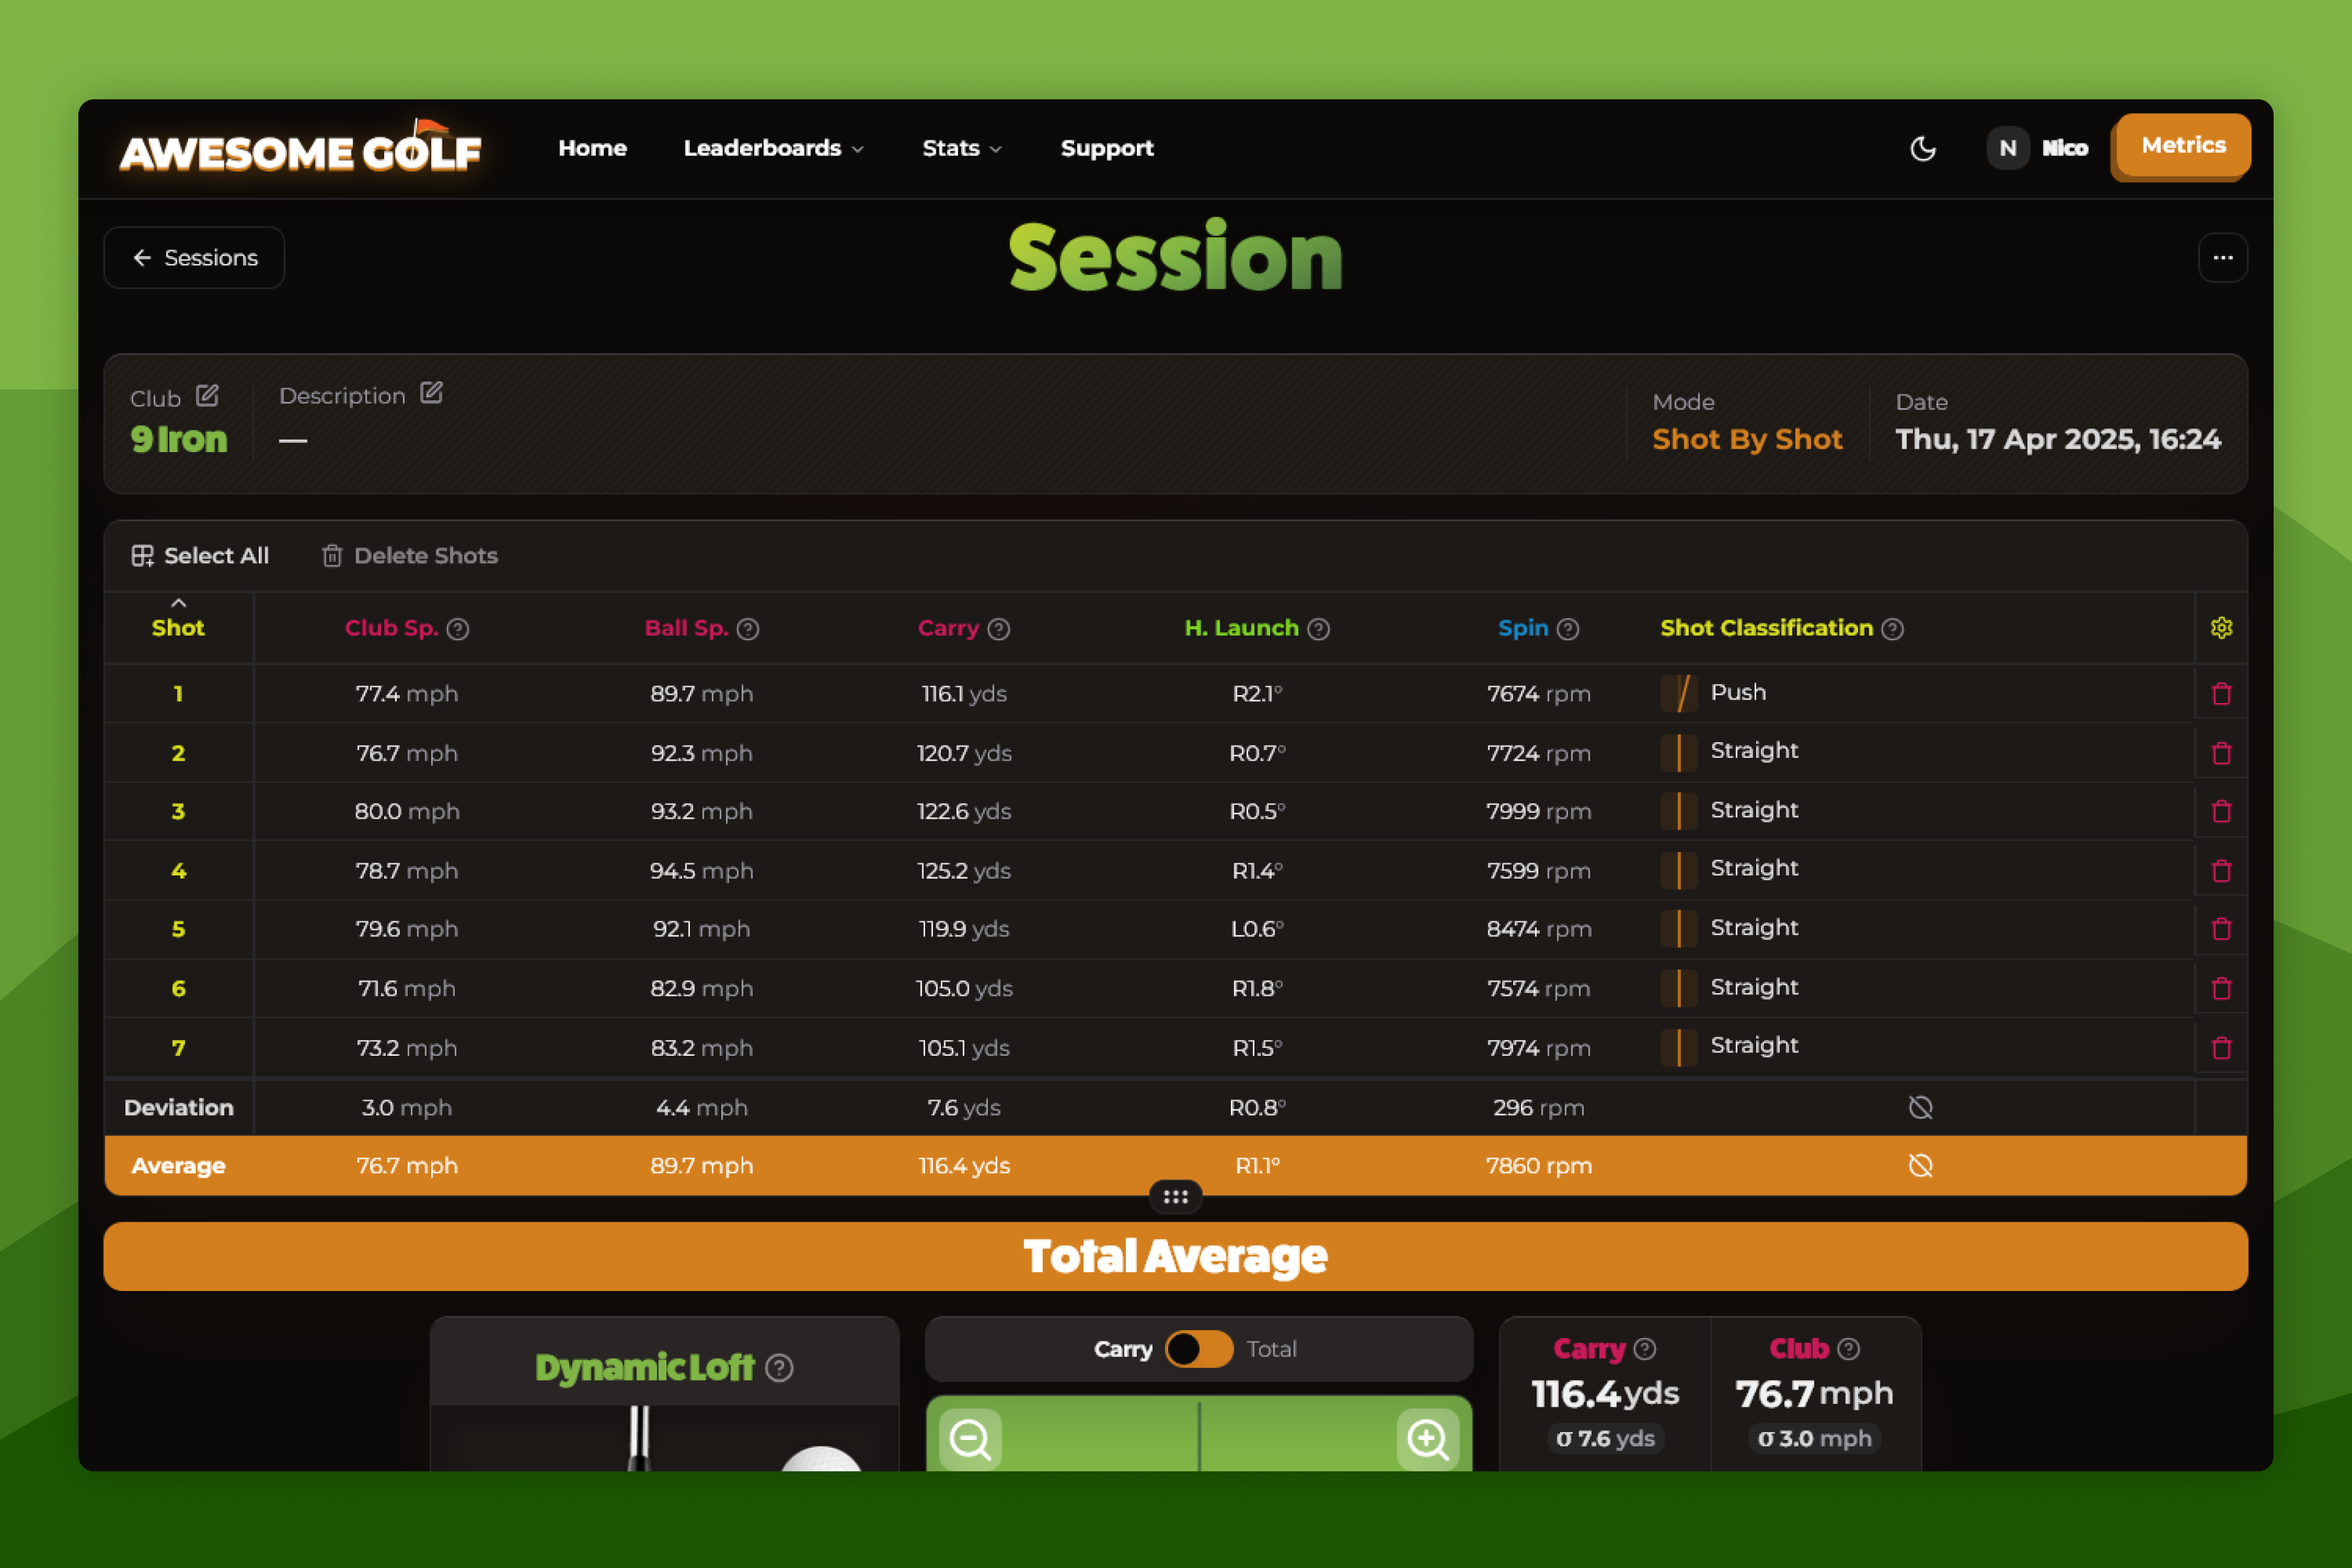
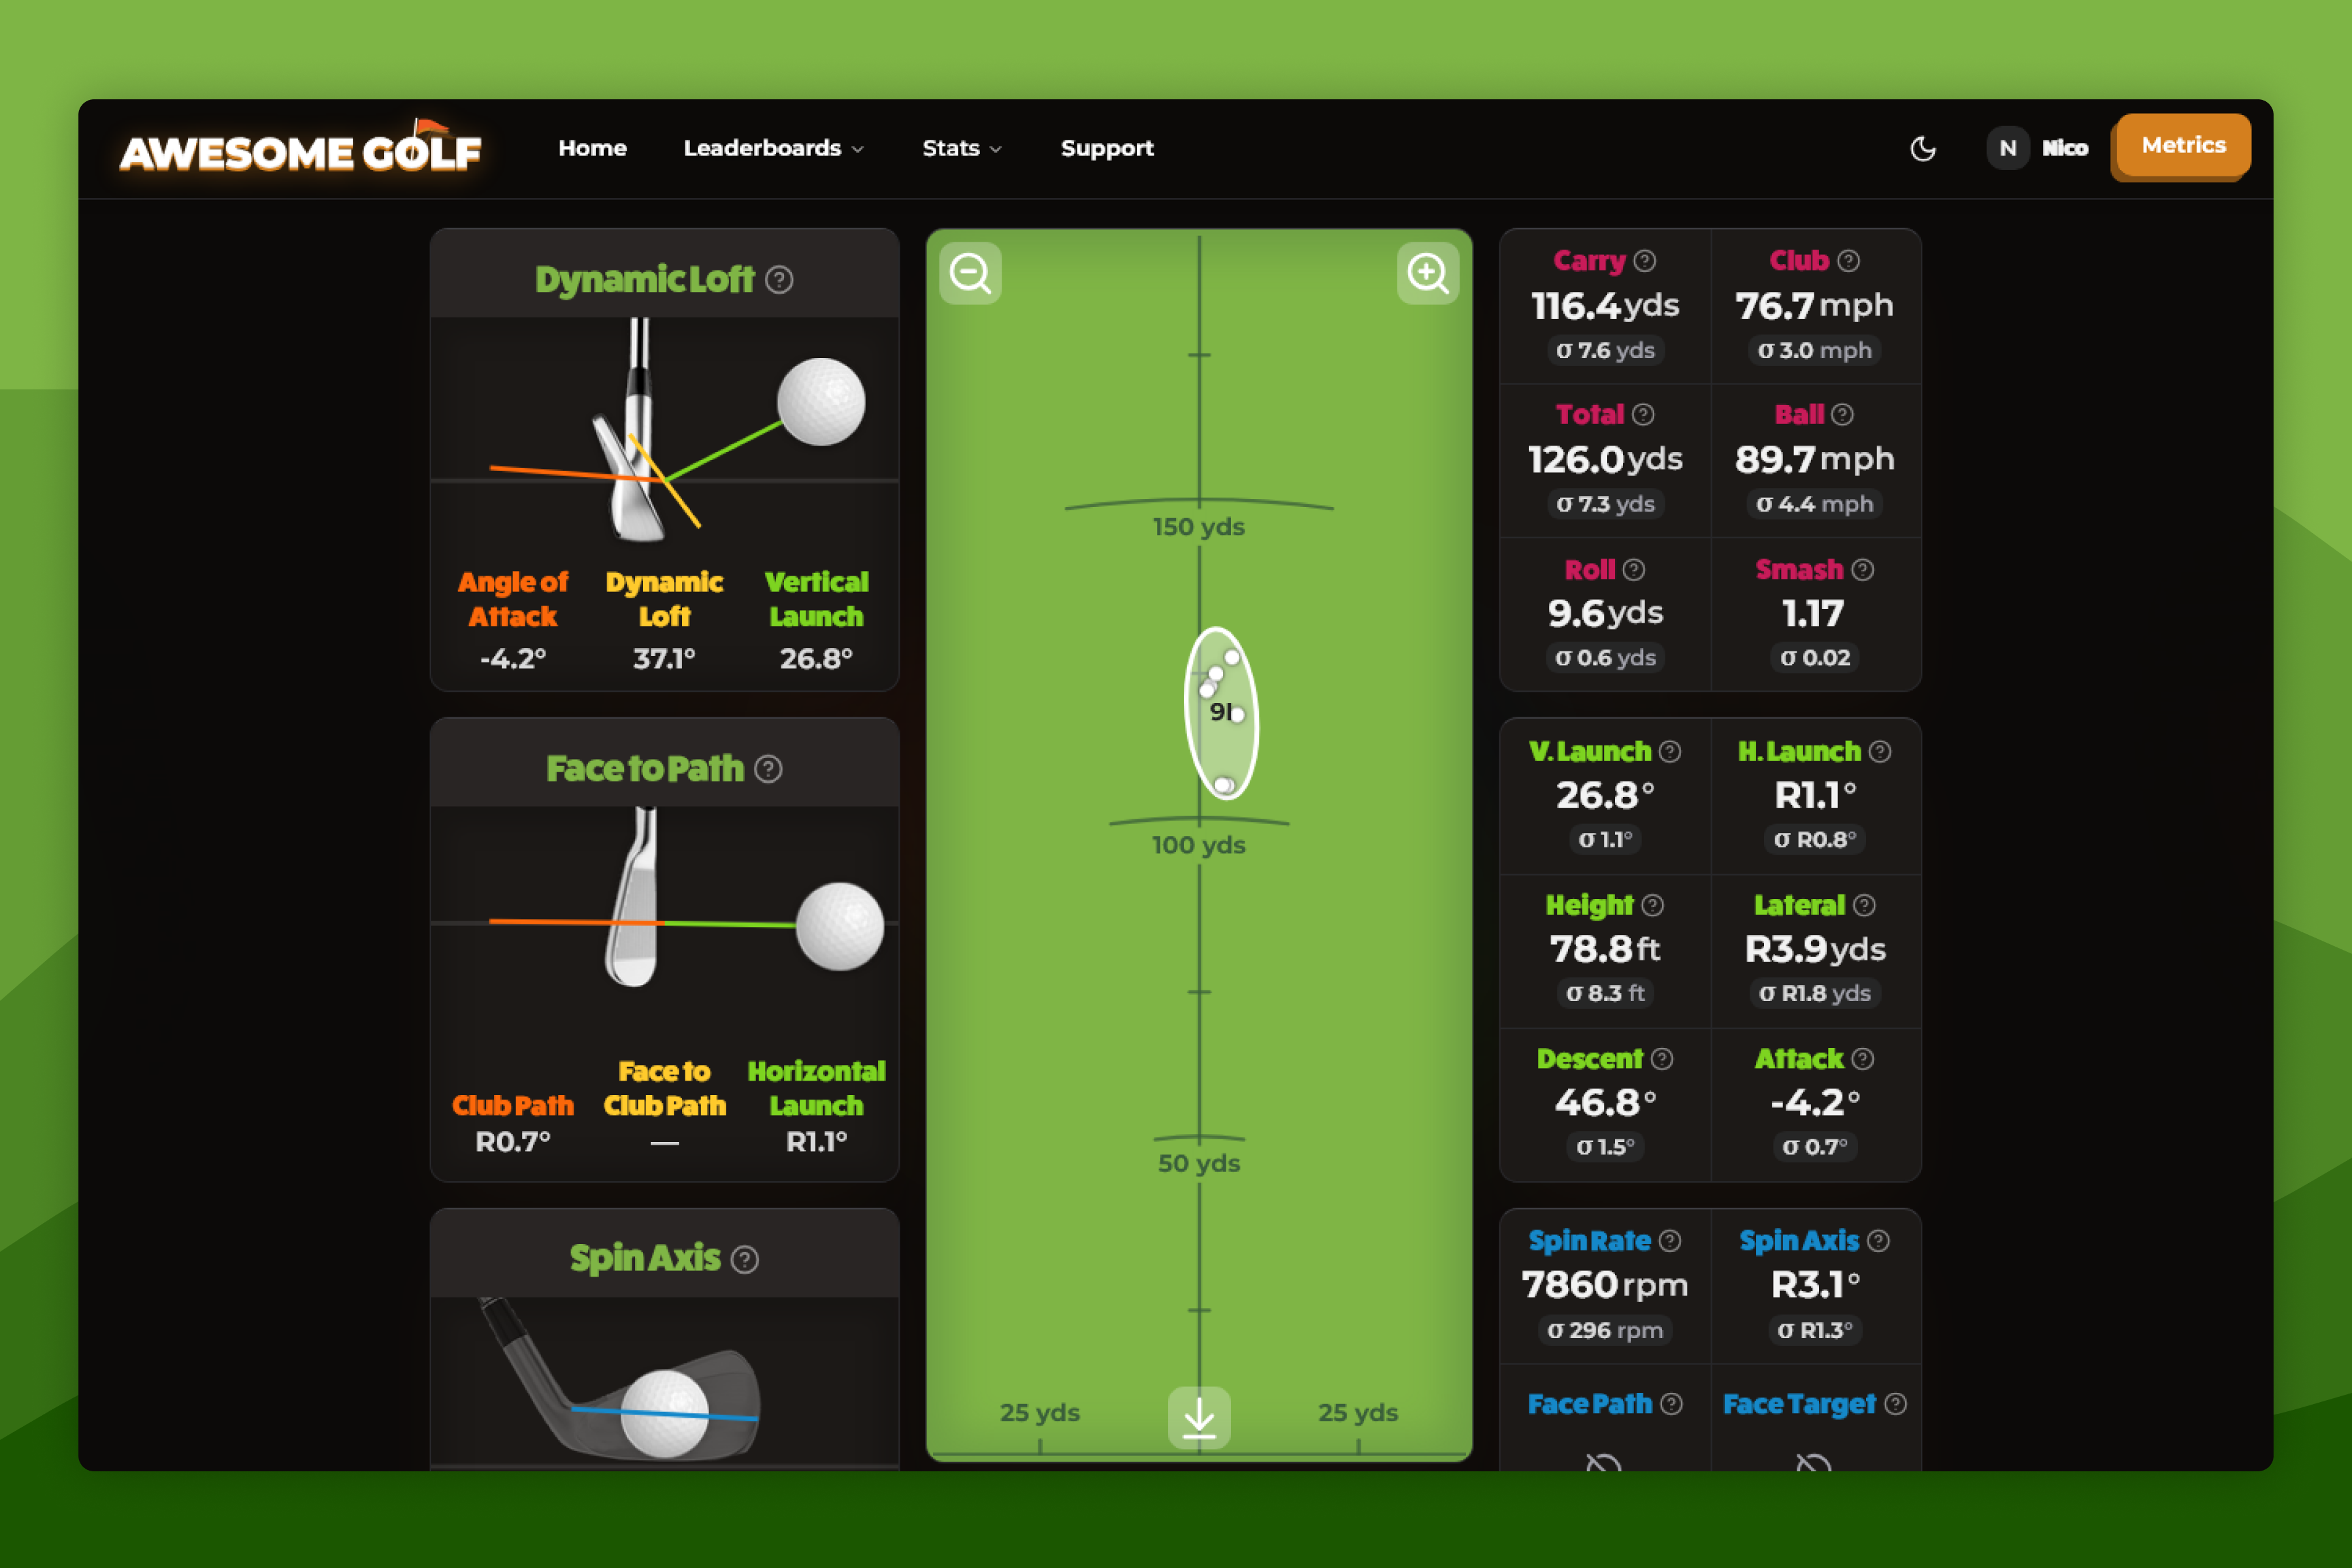
Session Total Averages
Below the Session Shots table, the data points and metrics for the session, or selected shots, are visualised in an outfield graphic with the displayed shots grouped in a circle to show the shots distance, accuracy, and consistency. Alongside the outfield, both the club and ball metrics are displayed, analysed, and visualised, showing both the metric's average and standard deviation for the displayed shots.
Virtual Golf Rounds
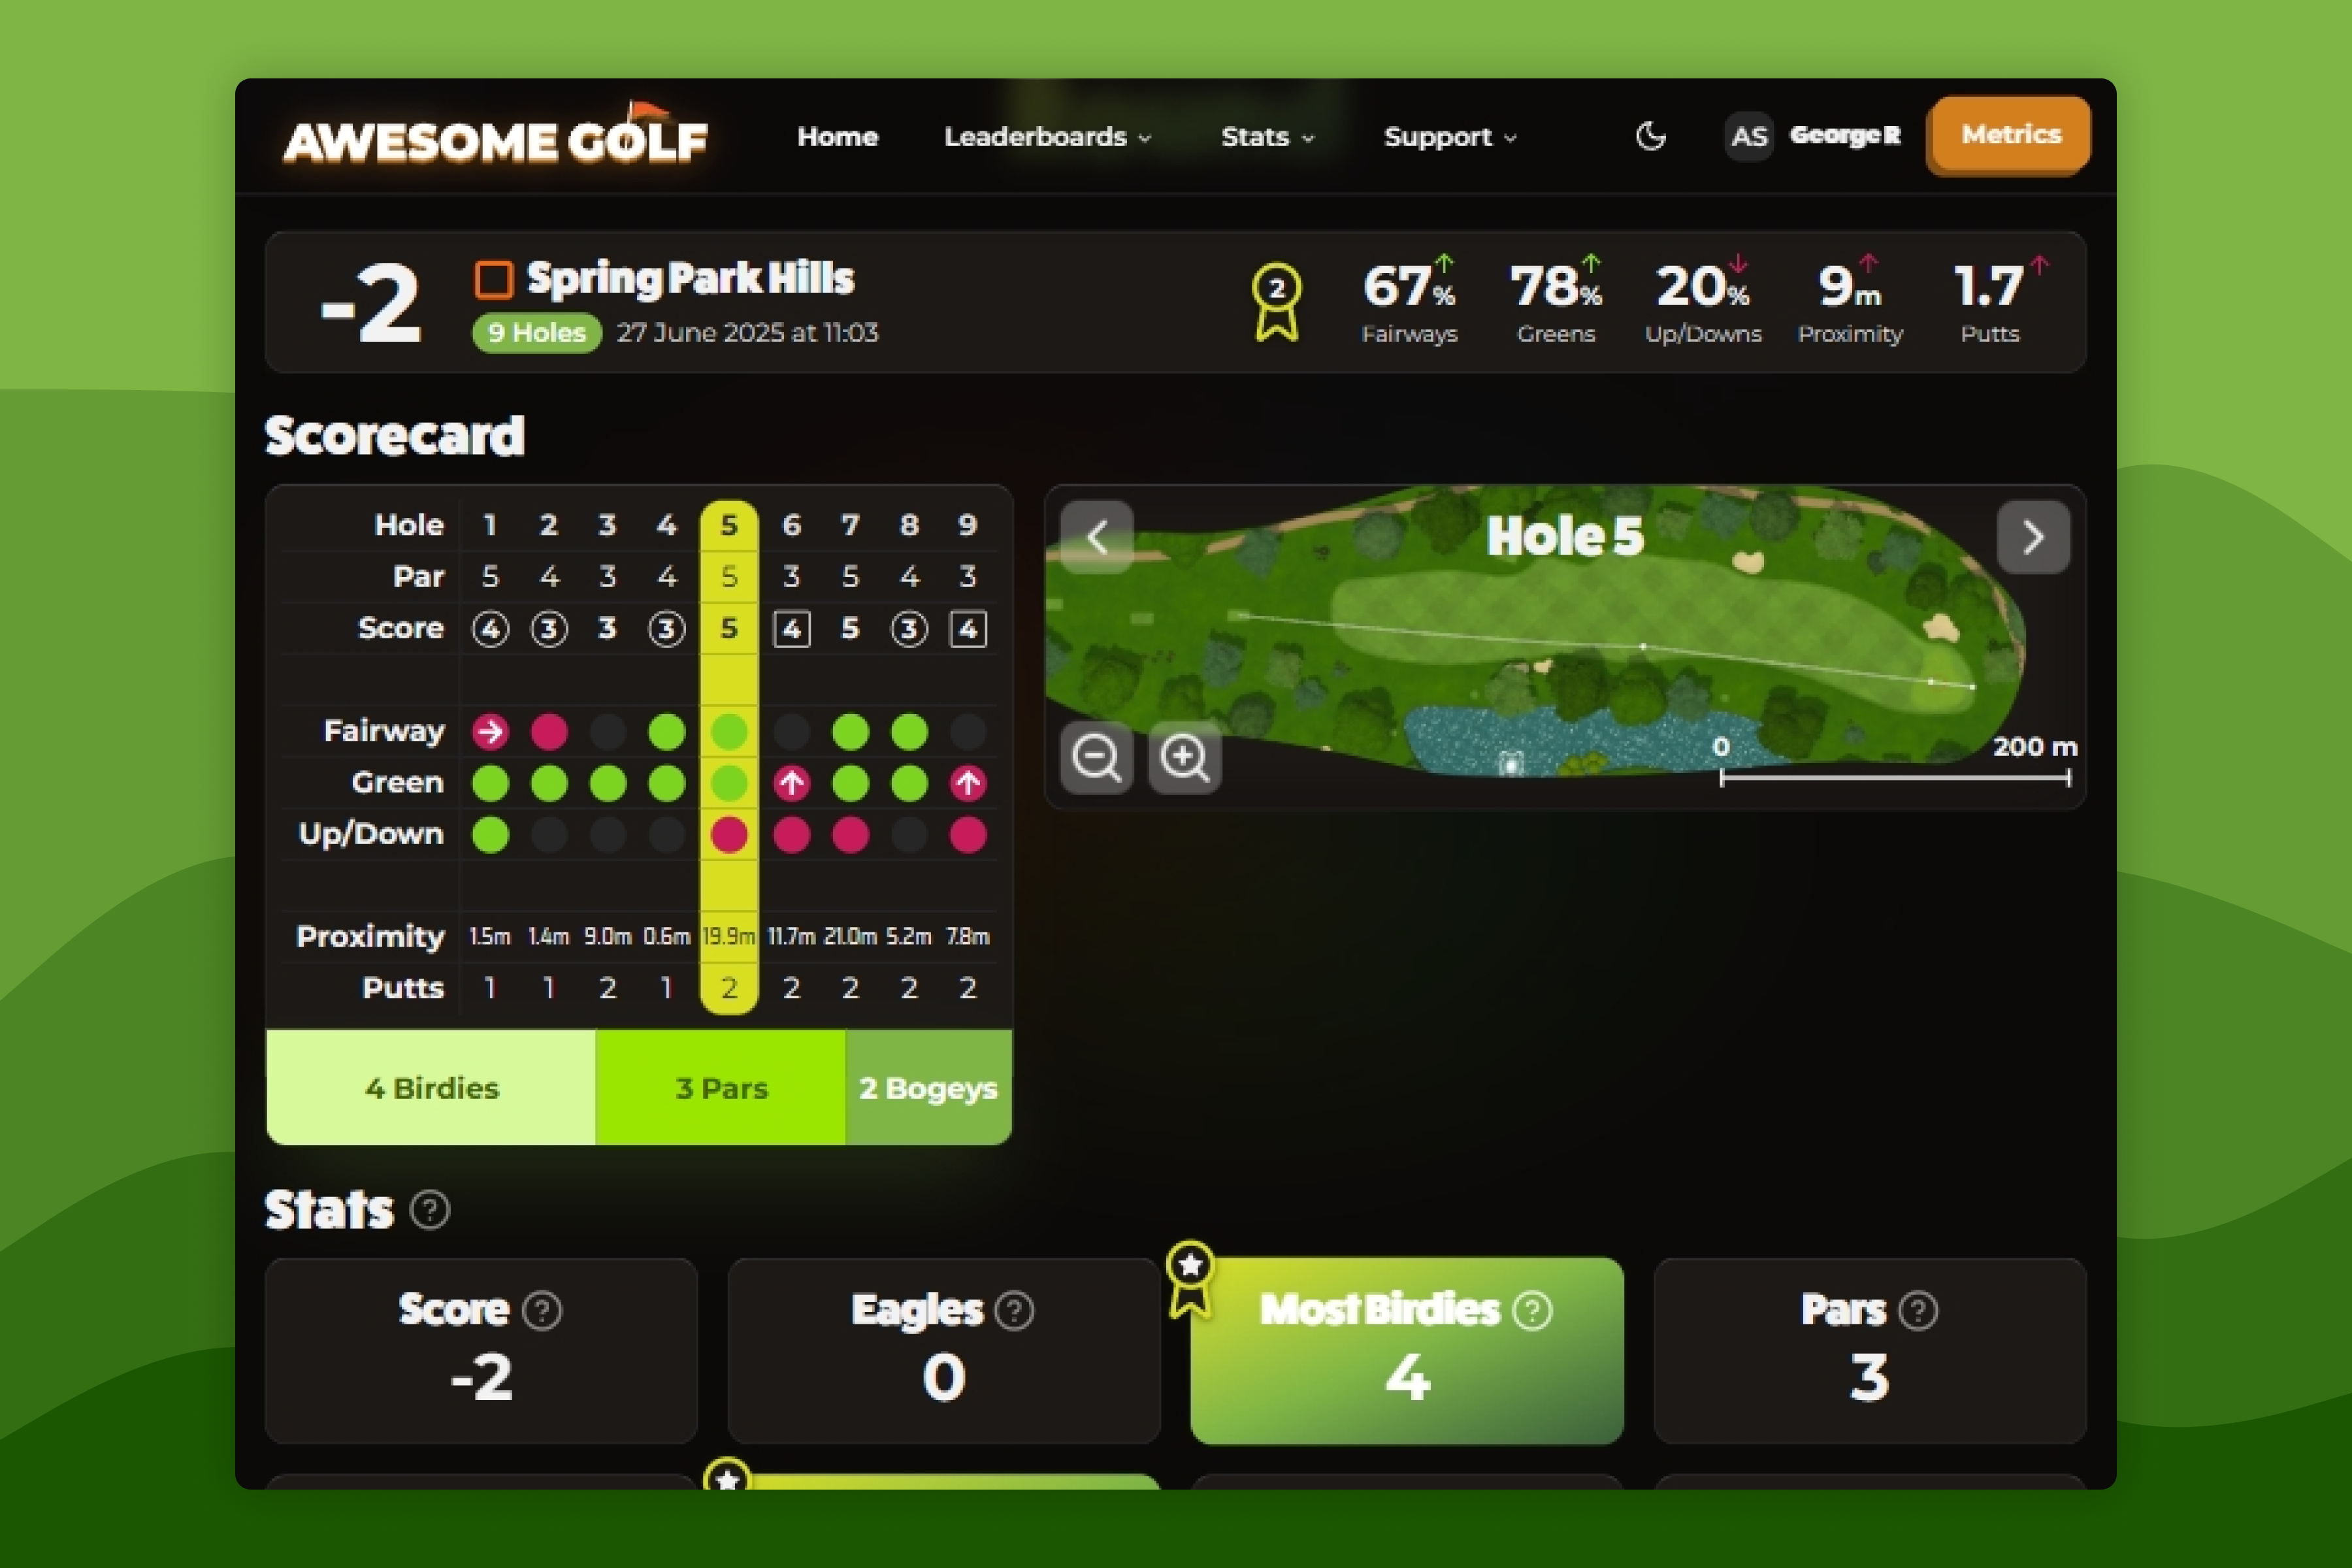
Virtual Golf Rounds in Awesome Golf Insights provides a dashboard of your performance whilst playing Virtual Golf rounds. This includes your scoring averages and personal bests.
Rounds includes your Virtual Golf scorecards to give you a visual representation of how you performed in each round with hole scores, fairways, greens, approach proximity, and any personal bests.
- Player Score: Your score for each hole is shown using golf broadcast-style shapes (circle for birdie, square for bogey, etc.) to visually indicate performance against par.
- Fairways: Shows whether your tee shot on par 4s and par 5s landed on the fairway. Misses are shown with arrows indicating if the shot went left, right, short, or long.
- Greens: Displays whether your approach shot reached the green in regulation. Misses include arrows to show general direction: left, right, short, or long.
- Up & Downs: Percentage of times you made a one-putt after getting the ball on the green from within 50 yards. Success is counted only when the shot finishes inside our 1-putt circle.
- Approach Shot Proximity: Tracks how close your approach shots (those intended to hit the green) finished, counting any ball ending within 25 yards of the front of the green, on the green, or beyond it.
- Total Putts per Hole: The number of putts you took on each hole, starting from when the ball is on the green surface.
Club Comparison
Club Comparison is a tool for comparing two different clubs to help you select the best club for you, or see your improvement with the same club over time. Here are some great ways to compare clubs:
- Compare the same club with different characteristics: You can do this by adding two of the same club during your practice session and giving them different text descriptions. For example, a driver with two different shafts, irons with two different lengths, or woods with different head weights.
- Compare two different clubs. For example, compare a 3-wood from Titleist against one from Callaway.
- Compare the same club over time. By using the timespan filters, you can see how your distance control and dispersion has changed over time with the same club. For example, how accurate you were with your sessions with a 9-iron, 3 years ago compared to the last 6 months.
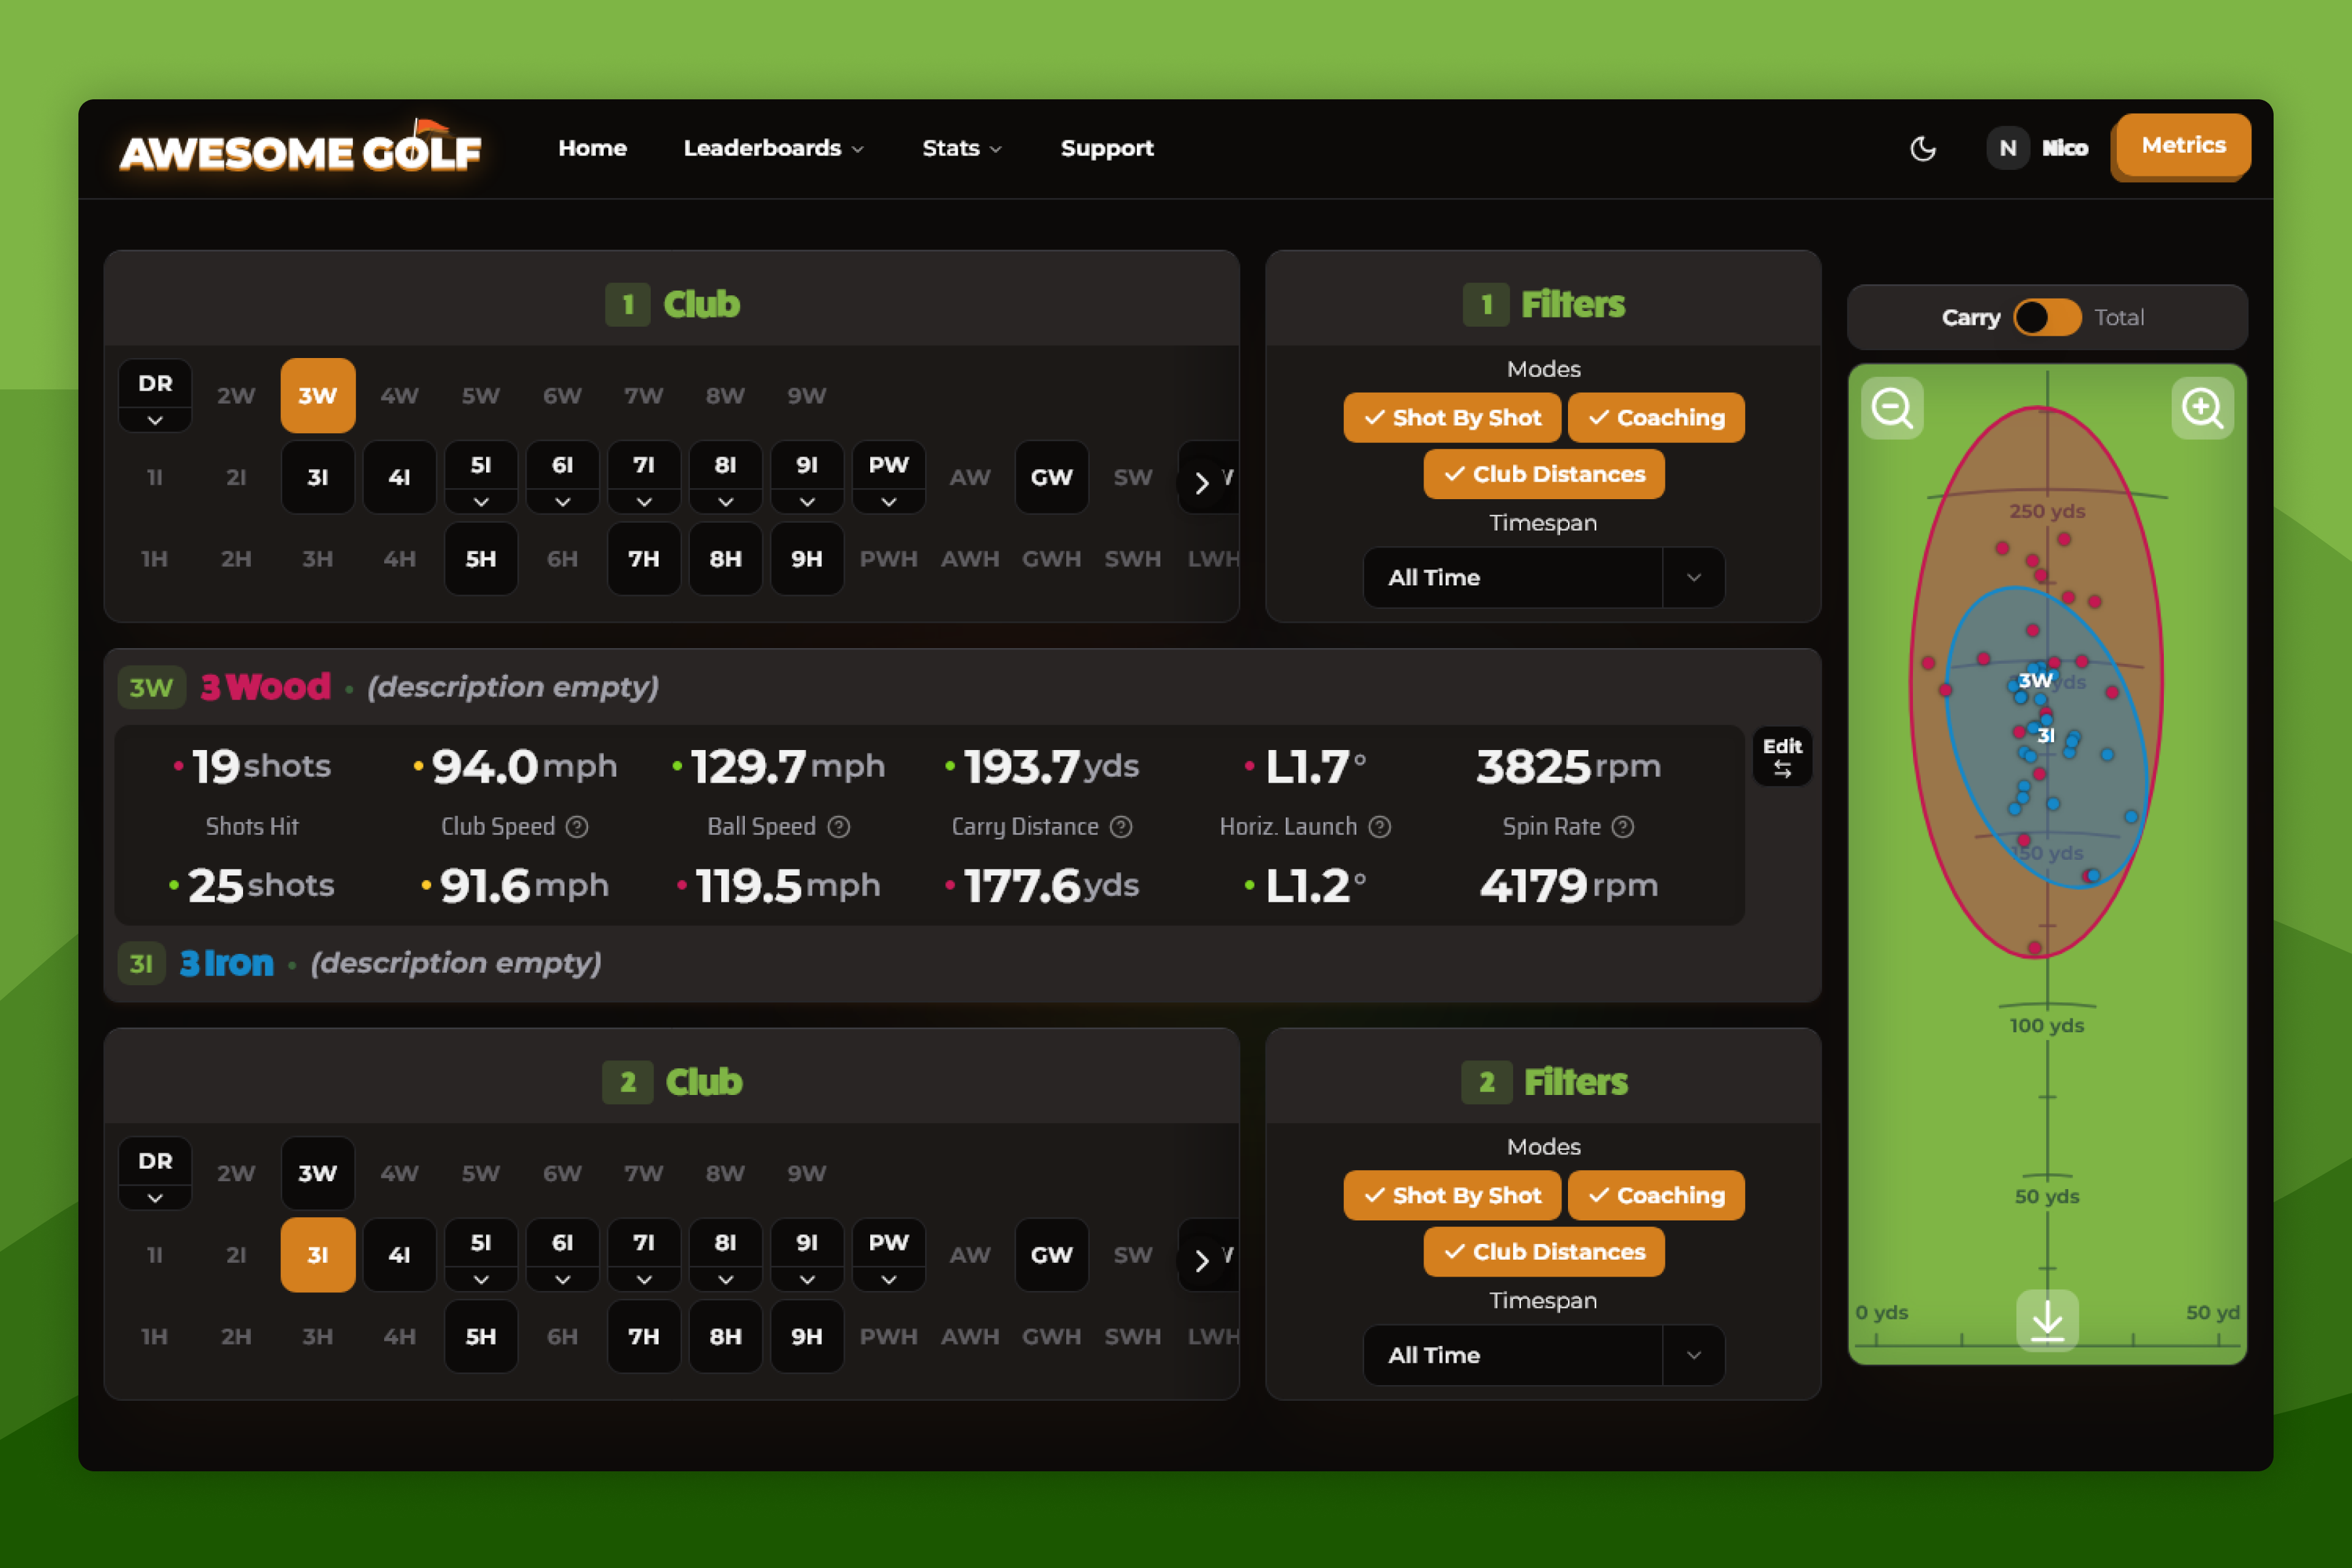
With the clubs you want to compare selected, you can choose which modes you want to analyse the data from and the timespan of those sessions. Clubs with multiple descriptions will show a dropdown (⌄) button to allow a single club description to be selected, individually. With the clubs selected, there are two ways to review the comparison of the clubs: the outfield visualiser, and the comparison table.
The outfield visualiser shows the grouping for each club, visually, and allowing you to instantly see the differences in distances, accuracy, and consistency. Each club is highlighted in red or blue on the visualisation, showing each shot as a point and a oval grouping the shots to show the consistency.
The comparison table shows more raw data and metrics, allowing you to choose and order which data points you're most interested in comparing. By clicking the Edit button in the comparison table, you can scroll horizontally to select which metrics are displayed and drag to reorder them to your preference.
Club Distances
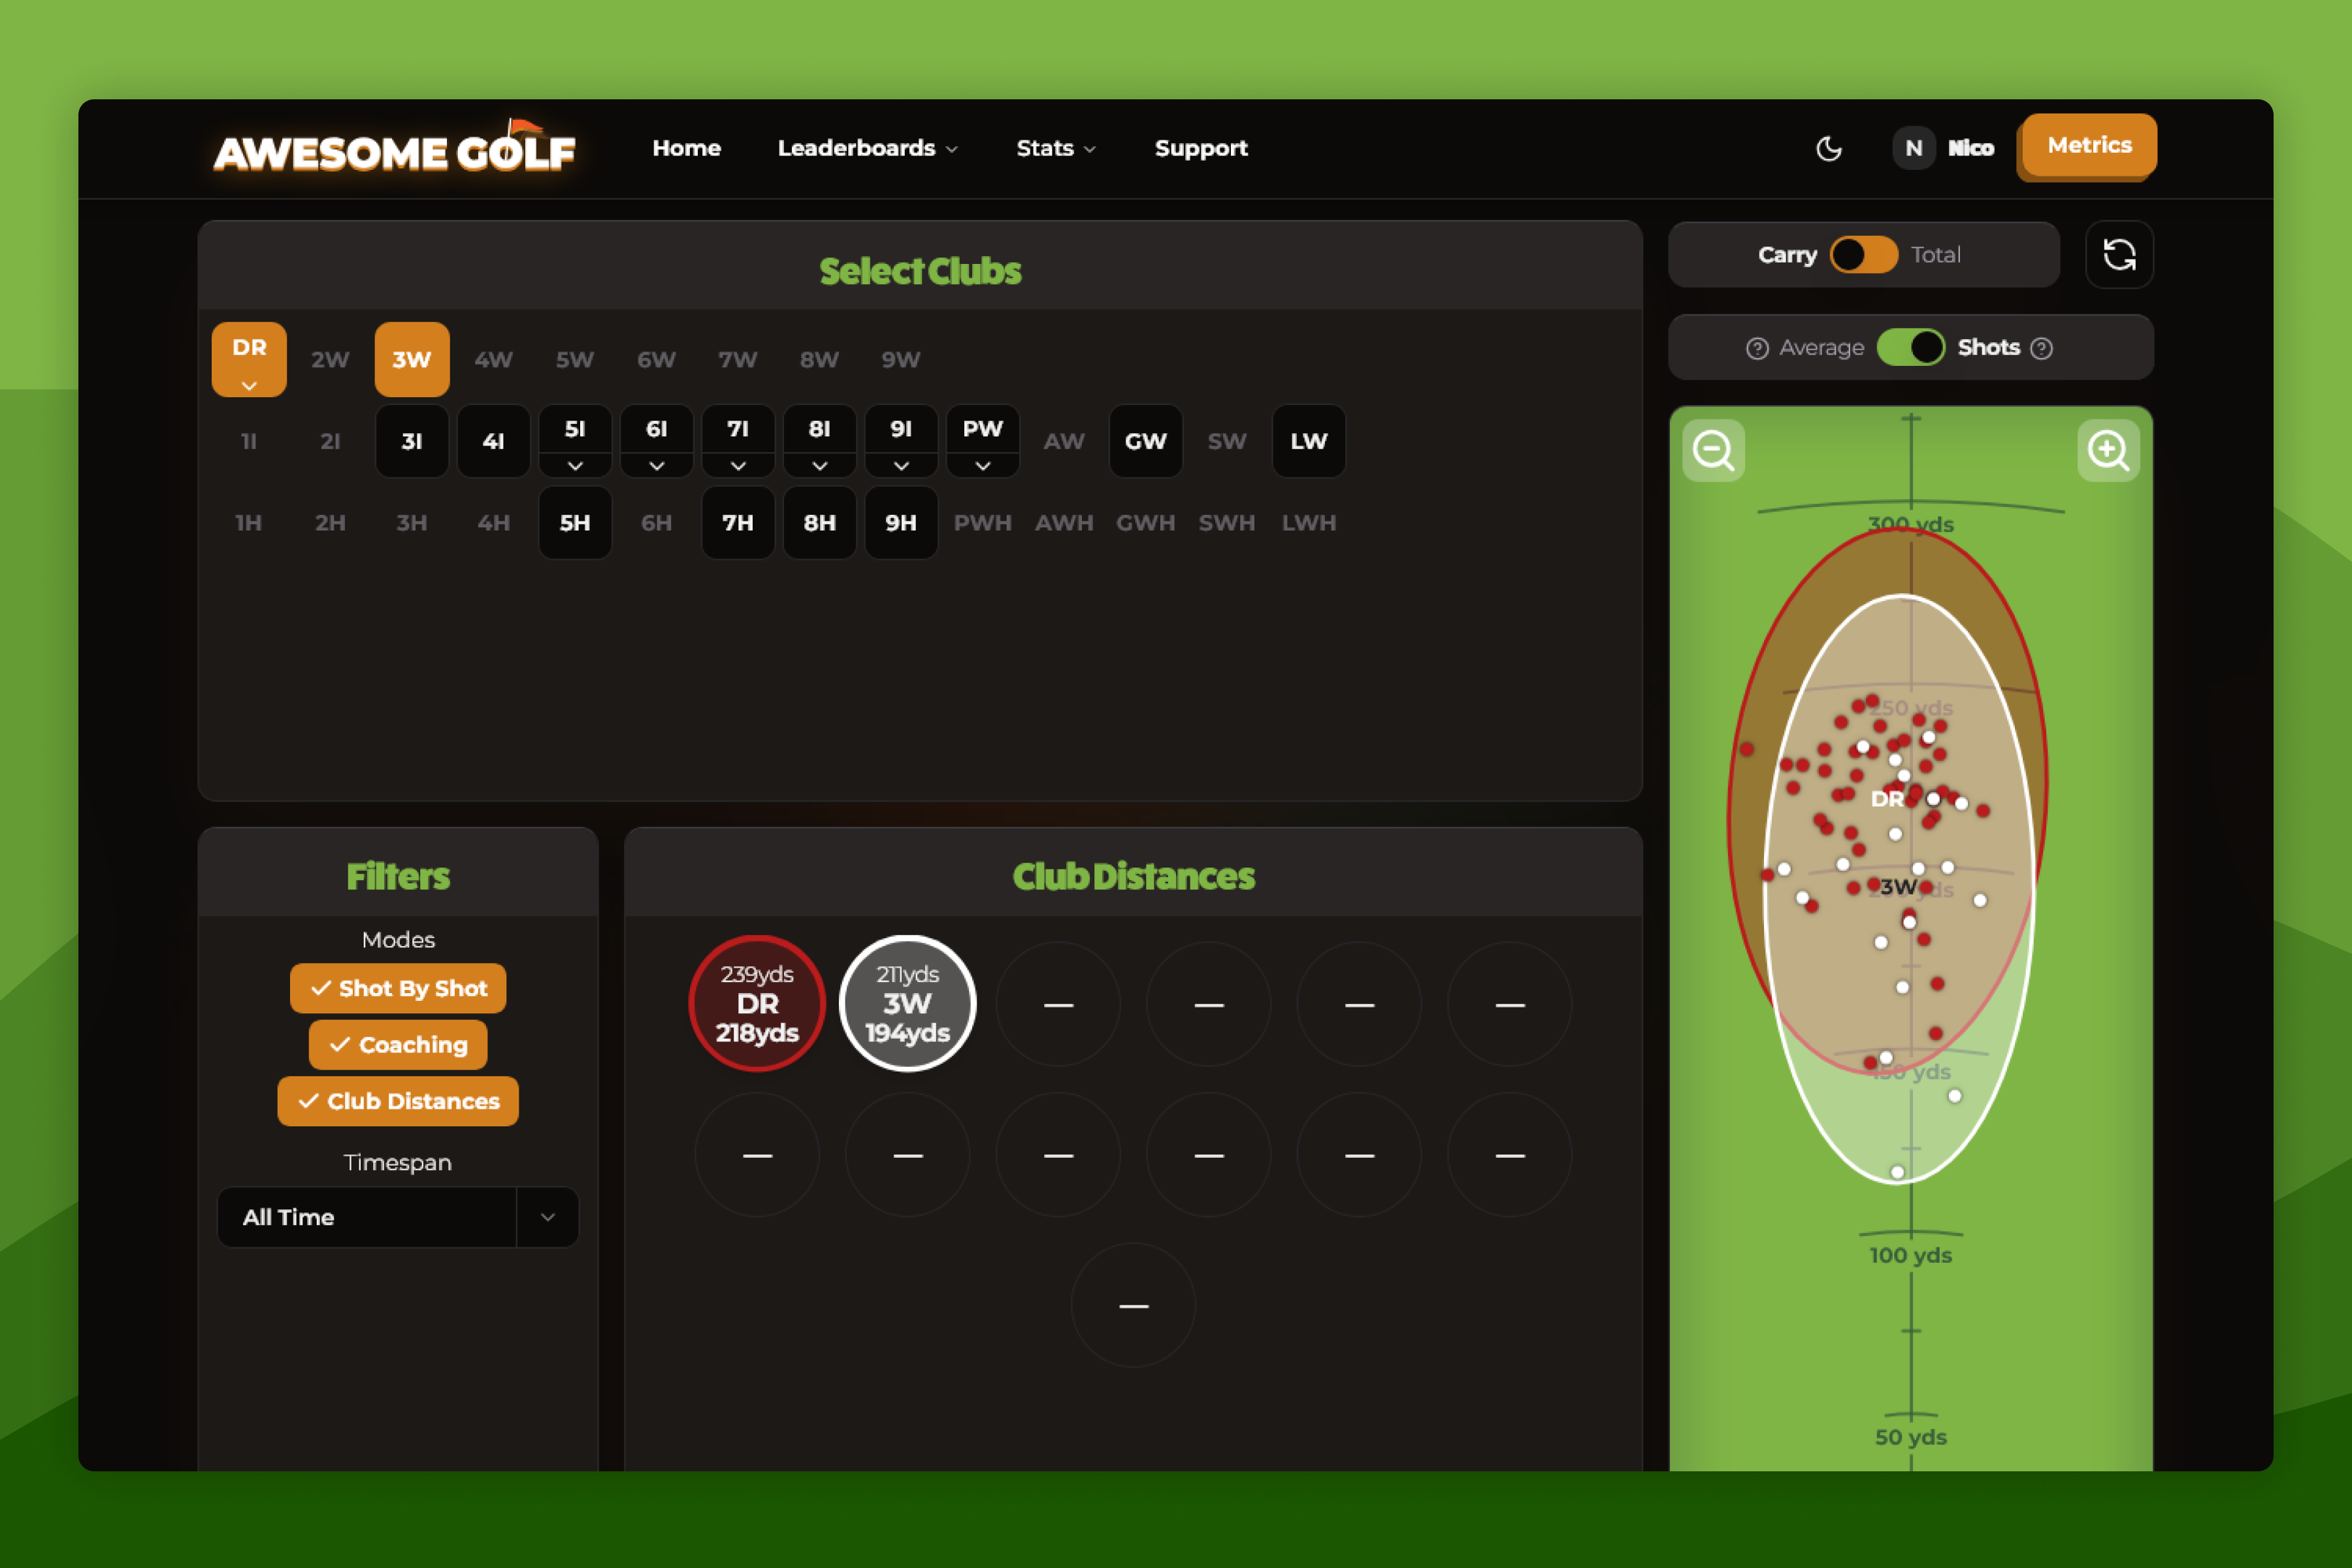
Club Distances is a tool to help you see how far each of your clubs go and identify any unusual distance gaps between clubs.
The first step is to select which clubs you'd like to view and compare; the set of selectable clubs shows the clubs with metrics tracked against - selecting a set of clubs will show the club's distances and outfield visualisation for comparing distances, accuracy, and consistency. Clubs with multiple descriptions will show a dropdown (⌄) button to allow a single club description to be selected, individually.
In the filters section, data from particular game modes can be filtered as well as filtering the timespan of the data shown.
The selected clubs will be highlighted with a coloured label and two numbers: the average total distance, on the top, and the average carry distance, on the bottom. Switching the Carry / Total toggle will change which of these numbers is highlighted and changes which is used for the shots and groupings on the outfield visualiser.
Additionally, switching the Average / Shots toggle will update the outfield visualiser between displaying the total average of your session data, and a random selection of 50 shots from each club during your sessions. Each club displays on the outfield visualiser in its respective colour and overlaid to show any crossover between club distances. The outfield visualiser can also be zoomed in or out - and can be dragged and scrolled to move around the visualisation.
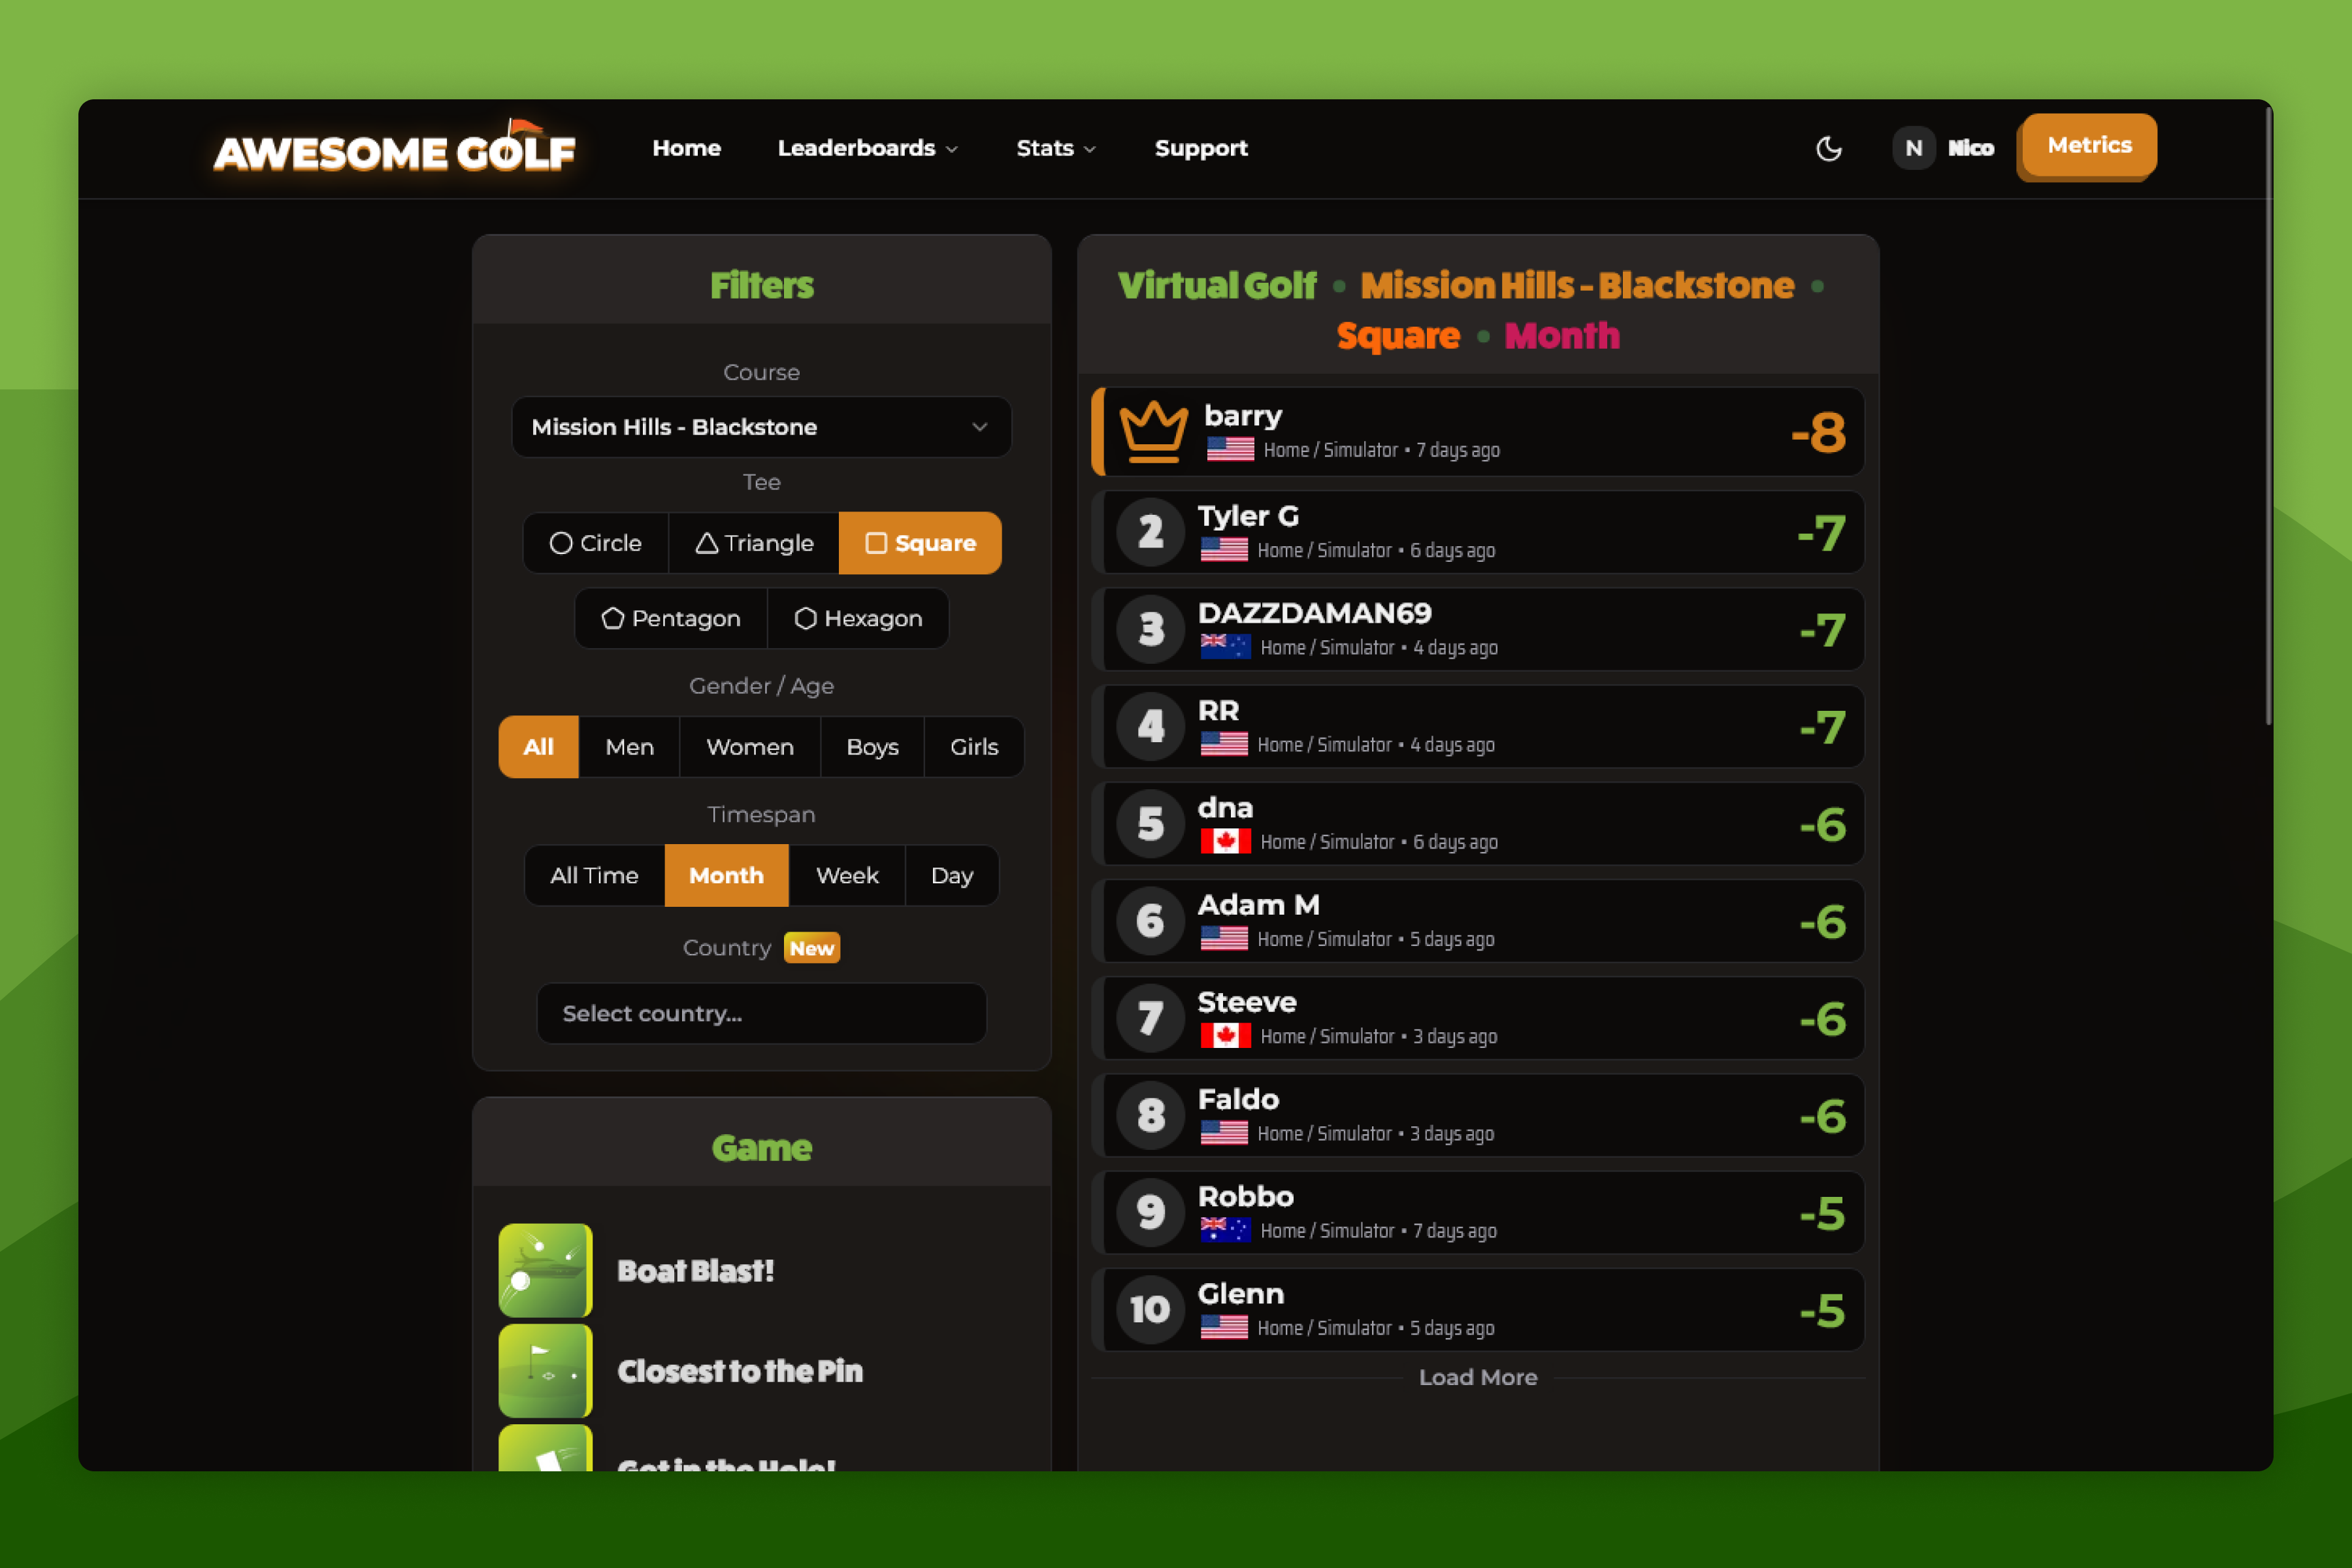
Leaderboards
The Leaderboards in Awesome Golf Insights show the best scores from golfers around the world in Awesome Golf Simulator, for each of the Awesome Golf game modes.
When you play Awesome Golf Simulator, your scores are entered into our global leaderboards - your placement in which is highlighted with a green border. Using the filters in the sidebar, the Awesome Golf leaderboards can be filtered by game mode, difficulty, gender/age, country, and timespan.
Each month we host at least two Global Competitions for you to test yourself against golfers worldwide. Additionally, some of our Driving Range and Indoor Facility venues host occasional location-specific competitions and leaderboards that you can enter whilst visiting the venue and using an Awesome Golf range bay. Some of these competitions may also include a prize for the competition's winner.