Review Your Sessions with Awesome Golf Insights
Once you've played a session of Shot by Shot, Coaching, or Club Distances in Awesome Golf Simulator, you'll be able to review your stats and performance for the game using Awesome Golf Insights.
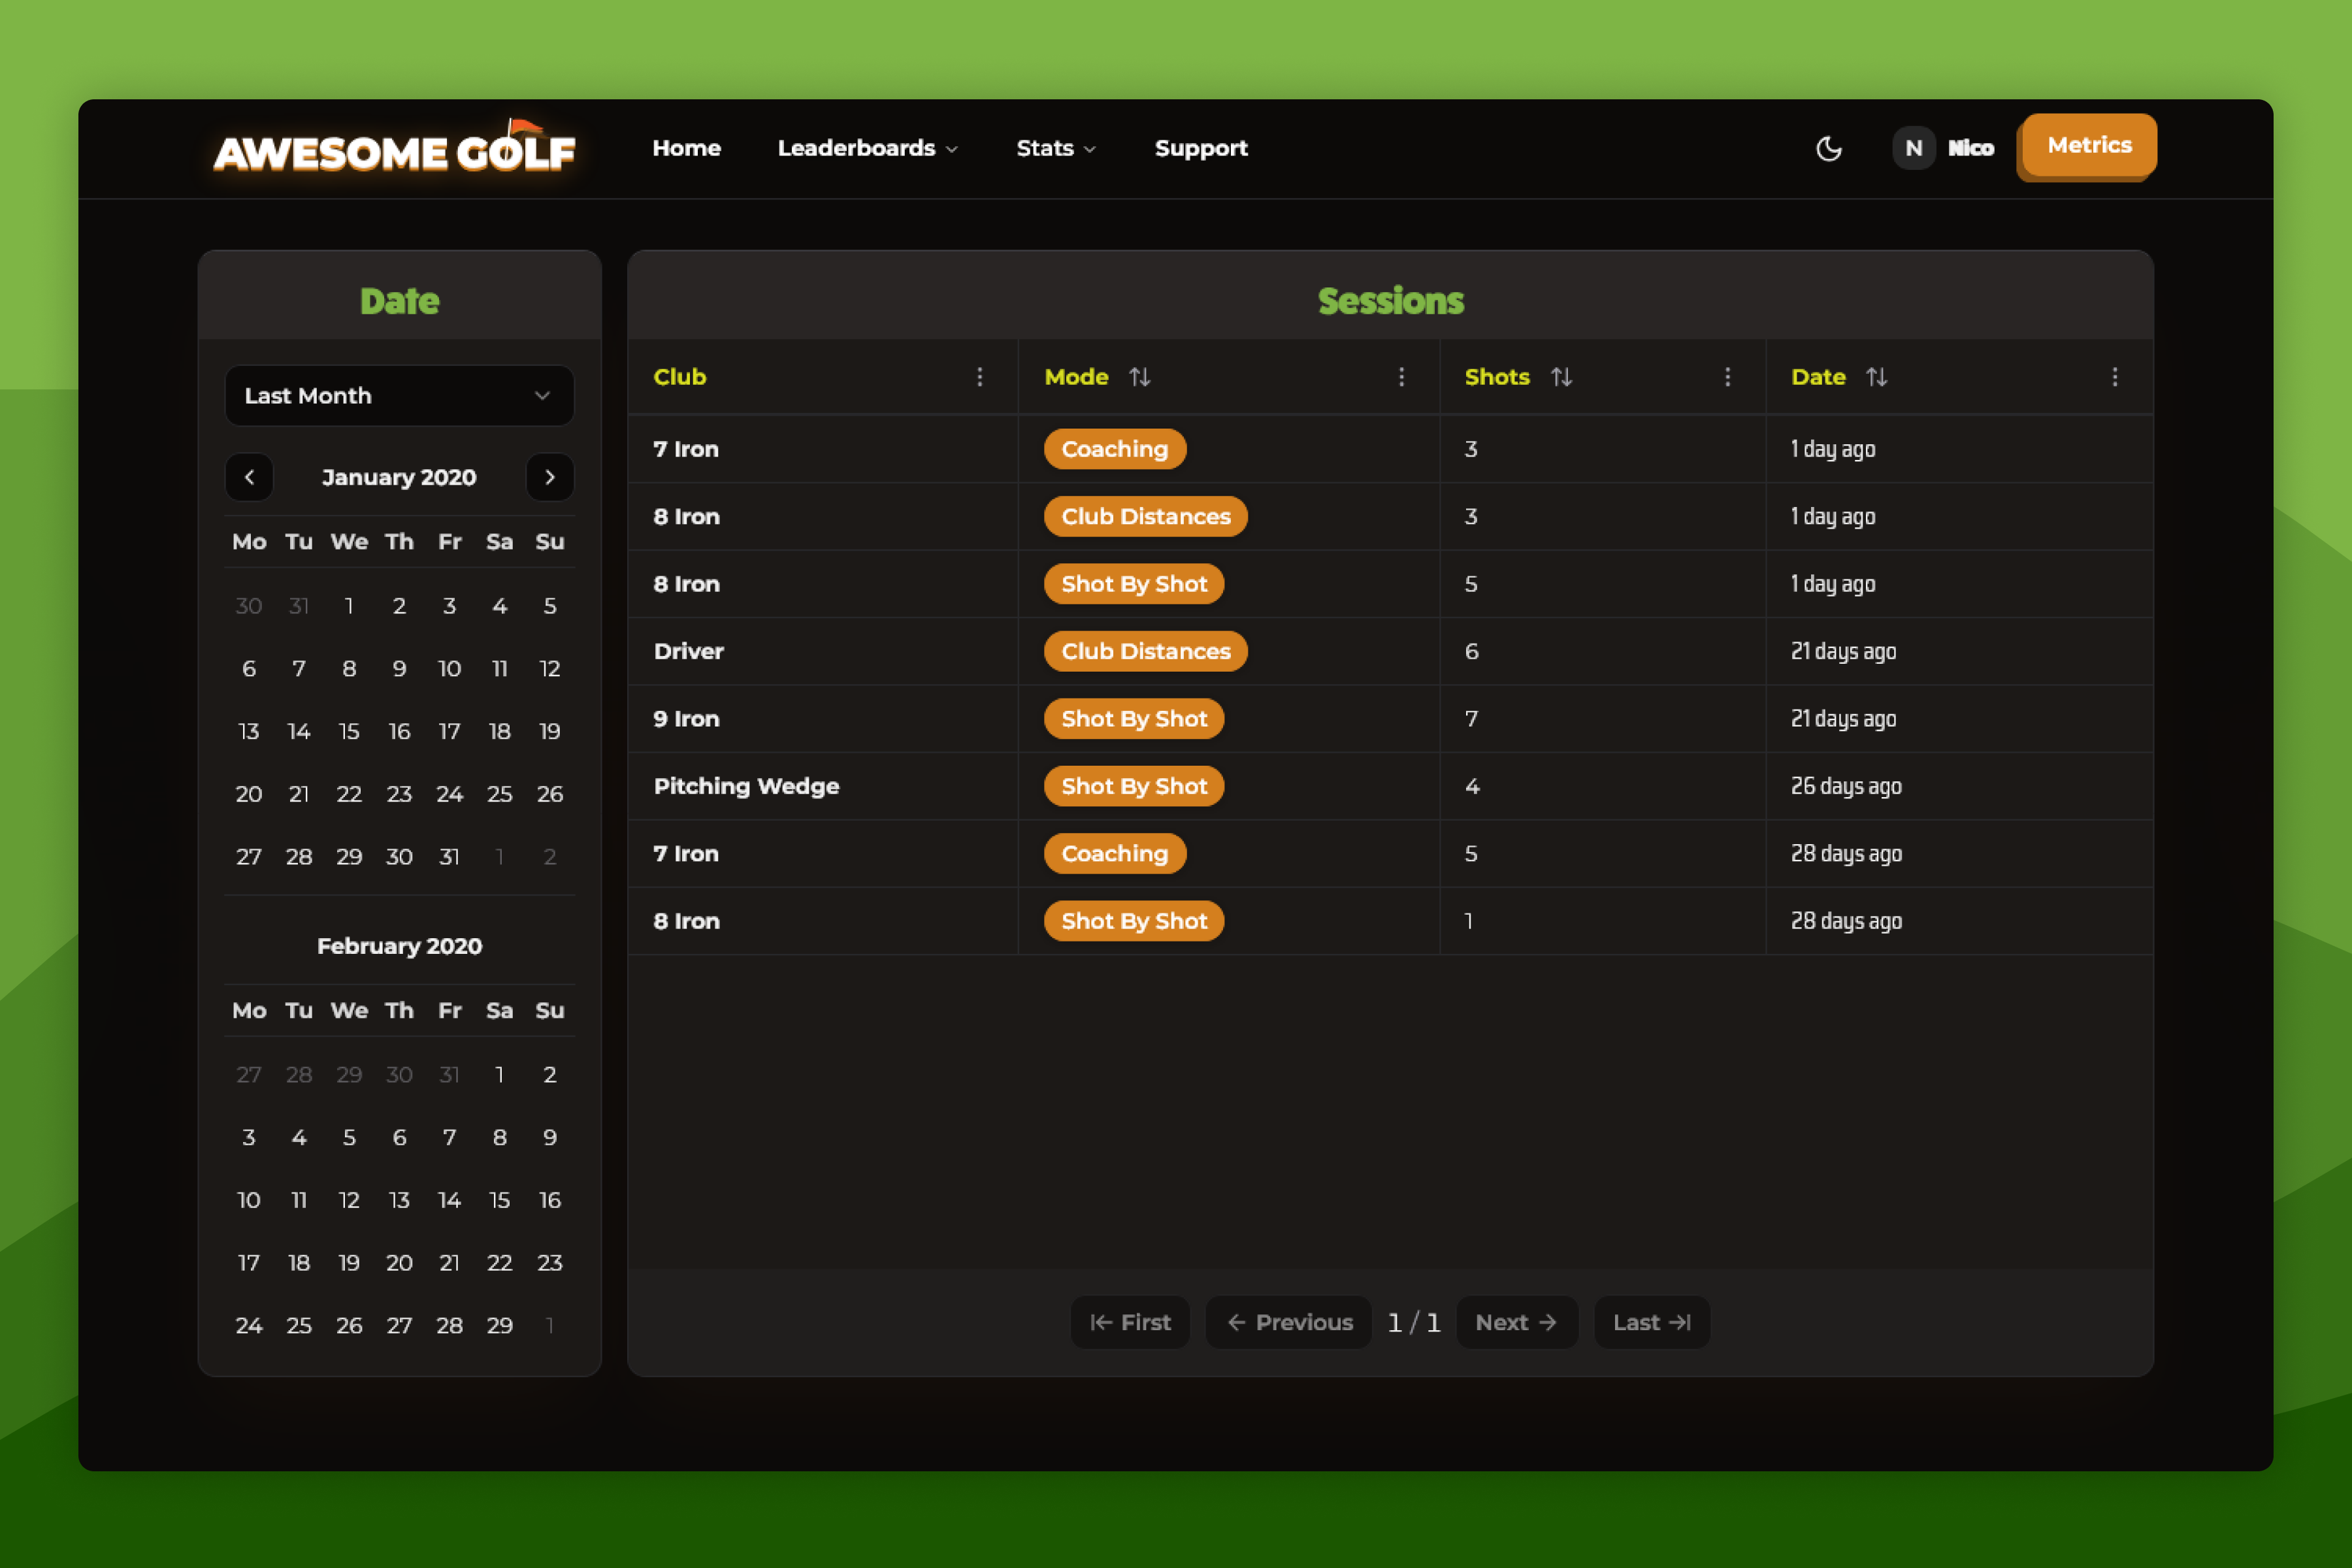
To see a list of your recent sessions, or filter by date to find a specific session, go to insights.awesome-golf.com/sessions, or select Stats in the navigation bar, then select Sessions in the dropdown dialogue. From this list of sessions, selecting one will open up all of the details and metrics for the session.
From the sidebar on the left-hand side, you can filter the list of sessions by time, and sort the results by selecting the arrows in each of the list's column headings. Additionally, if you have a lot of previous sessions, at the bottom of the list the Next / Previous buttons will allow you to step through pages of 10 sessions at a time.
With a session selected, you can analyse and review the data metrics from your Awesome Golf practice session. The session detail screen shows analysis and visualisation of your metrics in an individual session, with a section for Total Averages for the session's data points.
Session Overview
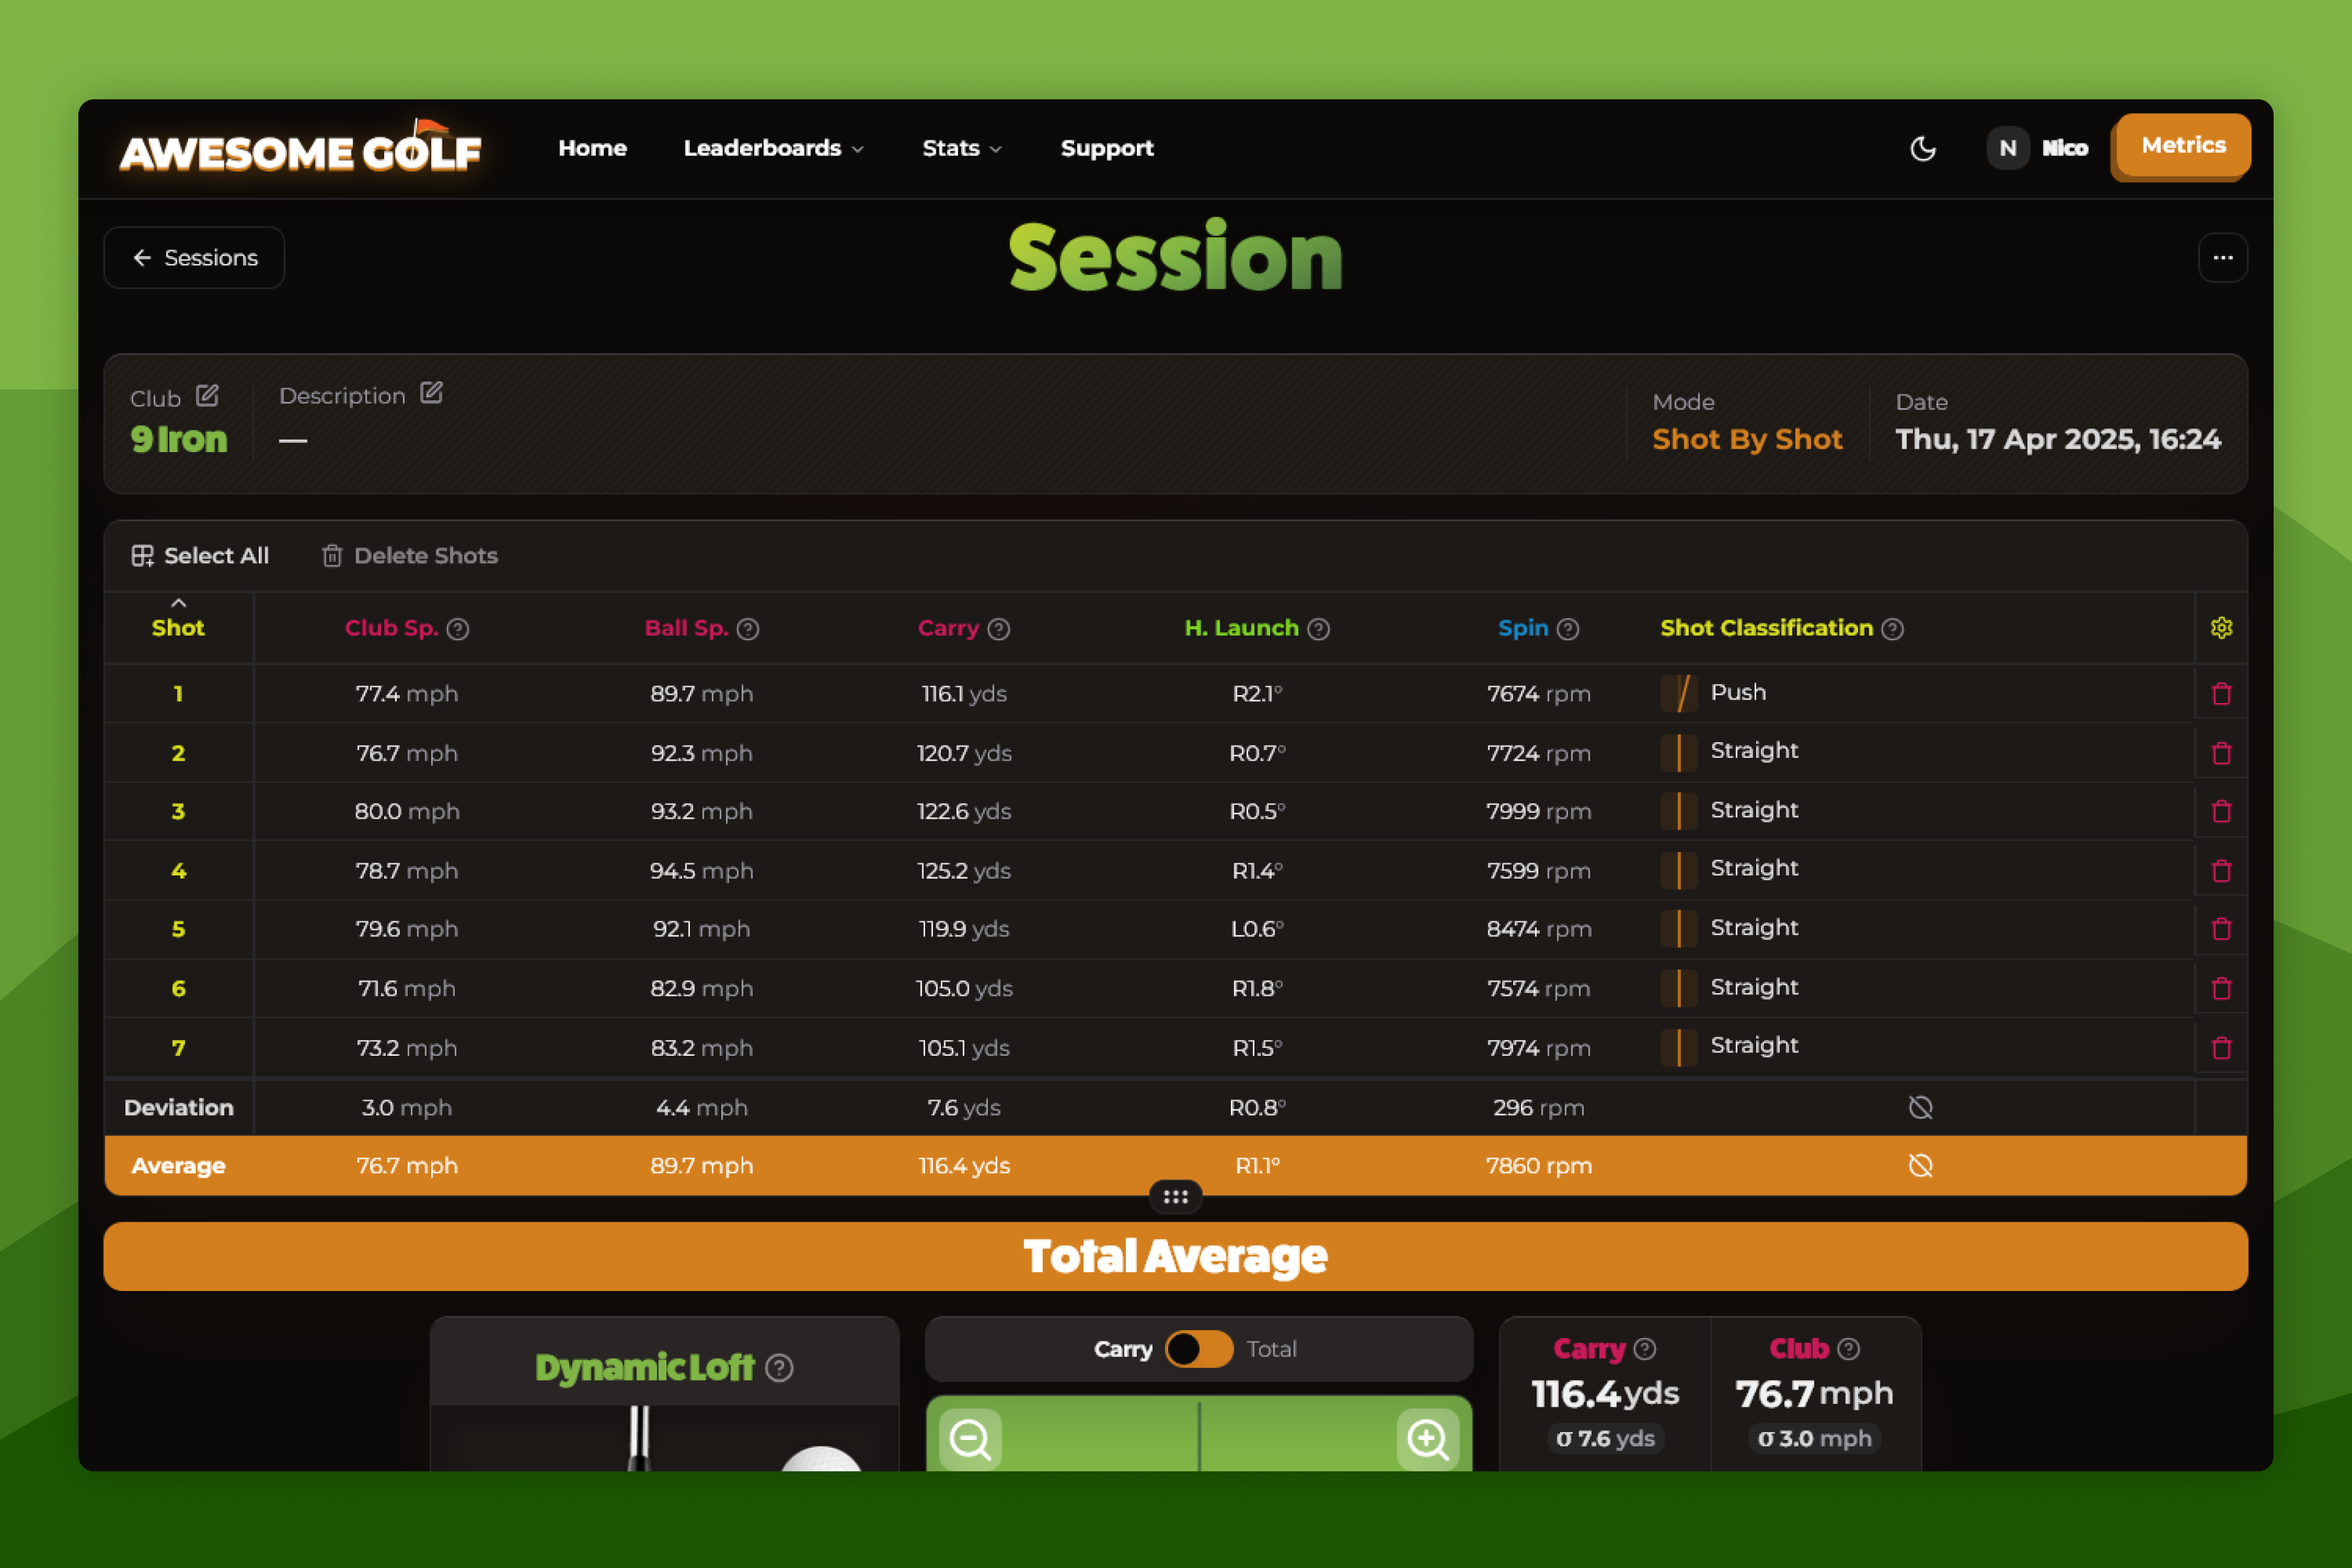
At the top of the session detail page, you'll see an overview of the session, with details about the club used in the session, the club's text description, the game mode the shots were hit in, and the date and time that the session was played. Selecting the edit (✏️) icon next to the Club or Description will allow you to update or rename those fields.
Additionally, in the top-right corner of the page, you'll find a small ... (ellipsis) button that will open a set of options to allow you to Delete Session, or Export CSV to download the session's shot stats as a CSV file in your browser.
Session Shots
Below the session overview, you'll see a table view of the shots from this session, sorted from oldest to most recent. For each shot you'll see a selection of the data points and metrics for the shot - and selecting the metric's heading in the table will allow you to sort the shots by that metric. Additionally, at the bottom the table, you'll see a row for Averages and Standard deviation for the shots in the table.
By default, this table will only show a selection of the available data metrics for each shot, however, different data points can also be displayed in this table by selecting the settings cog (⚙️) on the right-hand side of the table and toggling the display of different metrics' columns.
Hovering over the ? (question mark) icon in a next to a data metric's title will show a quick description of the data metric, with a Show Full Definition link to open up more key info on the metric from Awesome Golf Metrics in a dialogue. Columns can also be resized by dragging the divider between columns horizontally. Additionally, selecting and dragging the handle at the bottom will allow you to resize the rows.
Selecting one or more rows in the session shots table will highlight them and update the Averages, Standard Deviations, and Total Averages section, to display the analysis for the selected shots only. With multiple shots selected, you'll be able to remove the selected shots by selecting the shots, then selecting Delete X Shots at the top of the table. Alternatively, individual shots can be deleted from the session by selecting the red bin icon (🗑️) on the right-hand side of the row. Deleted shots and sessions cannot be recovered after deletion.
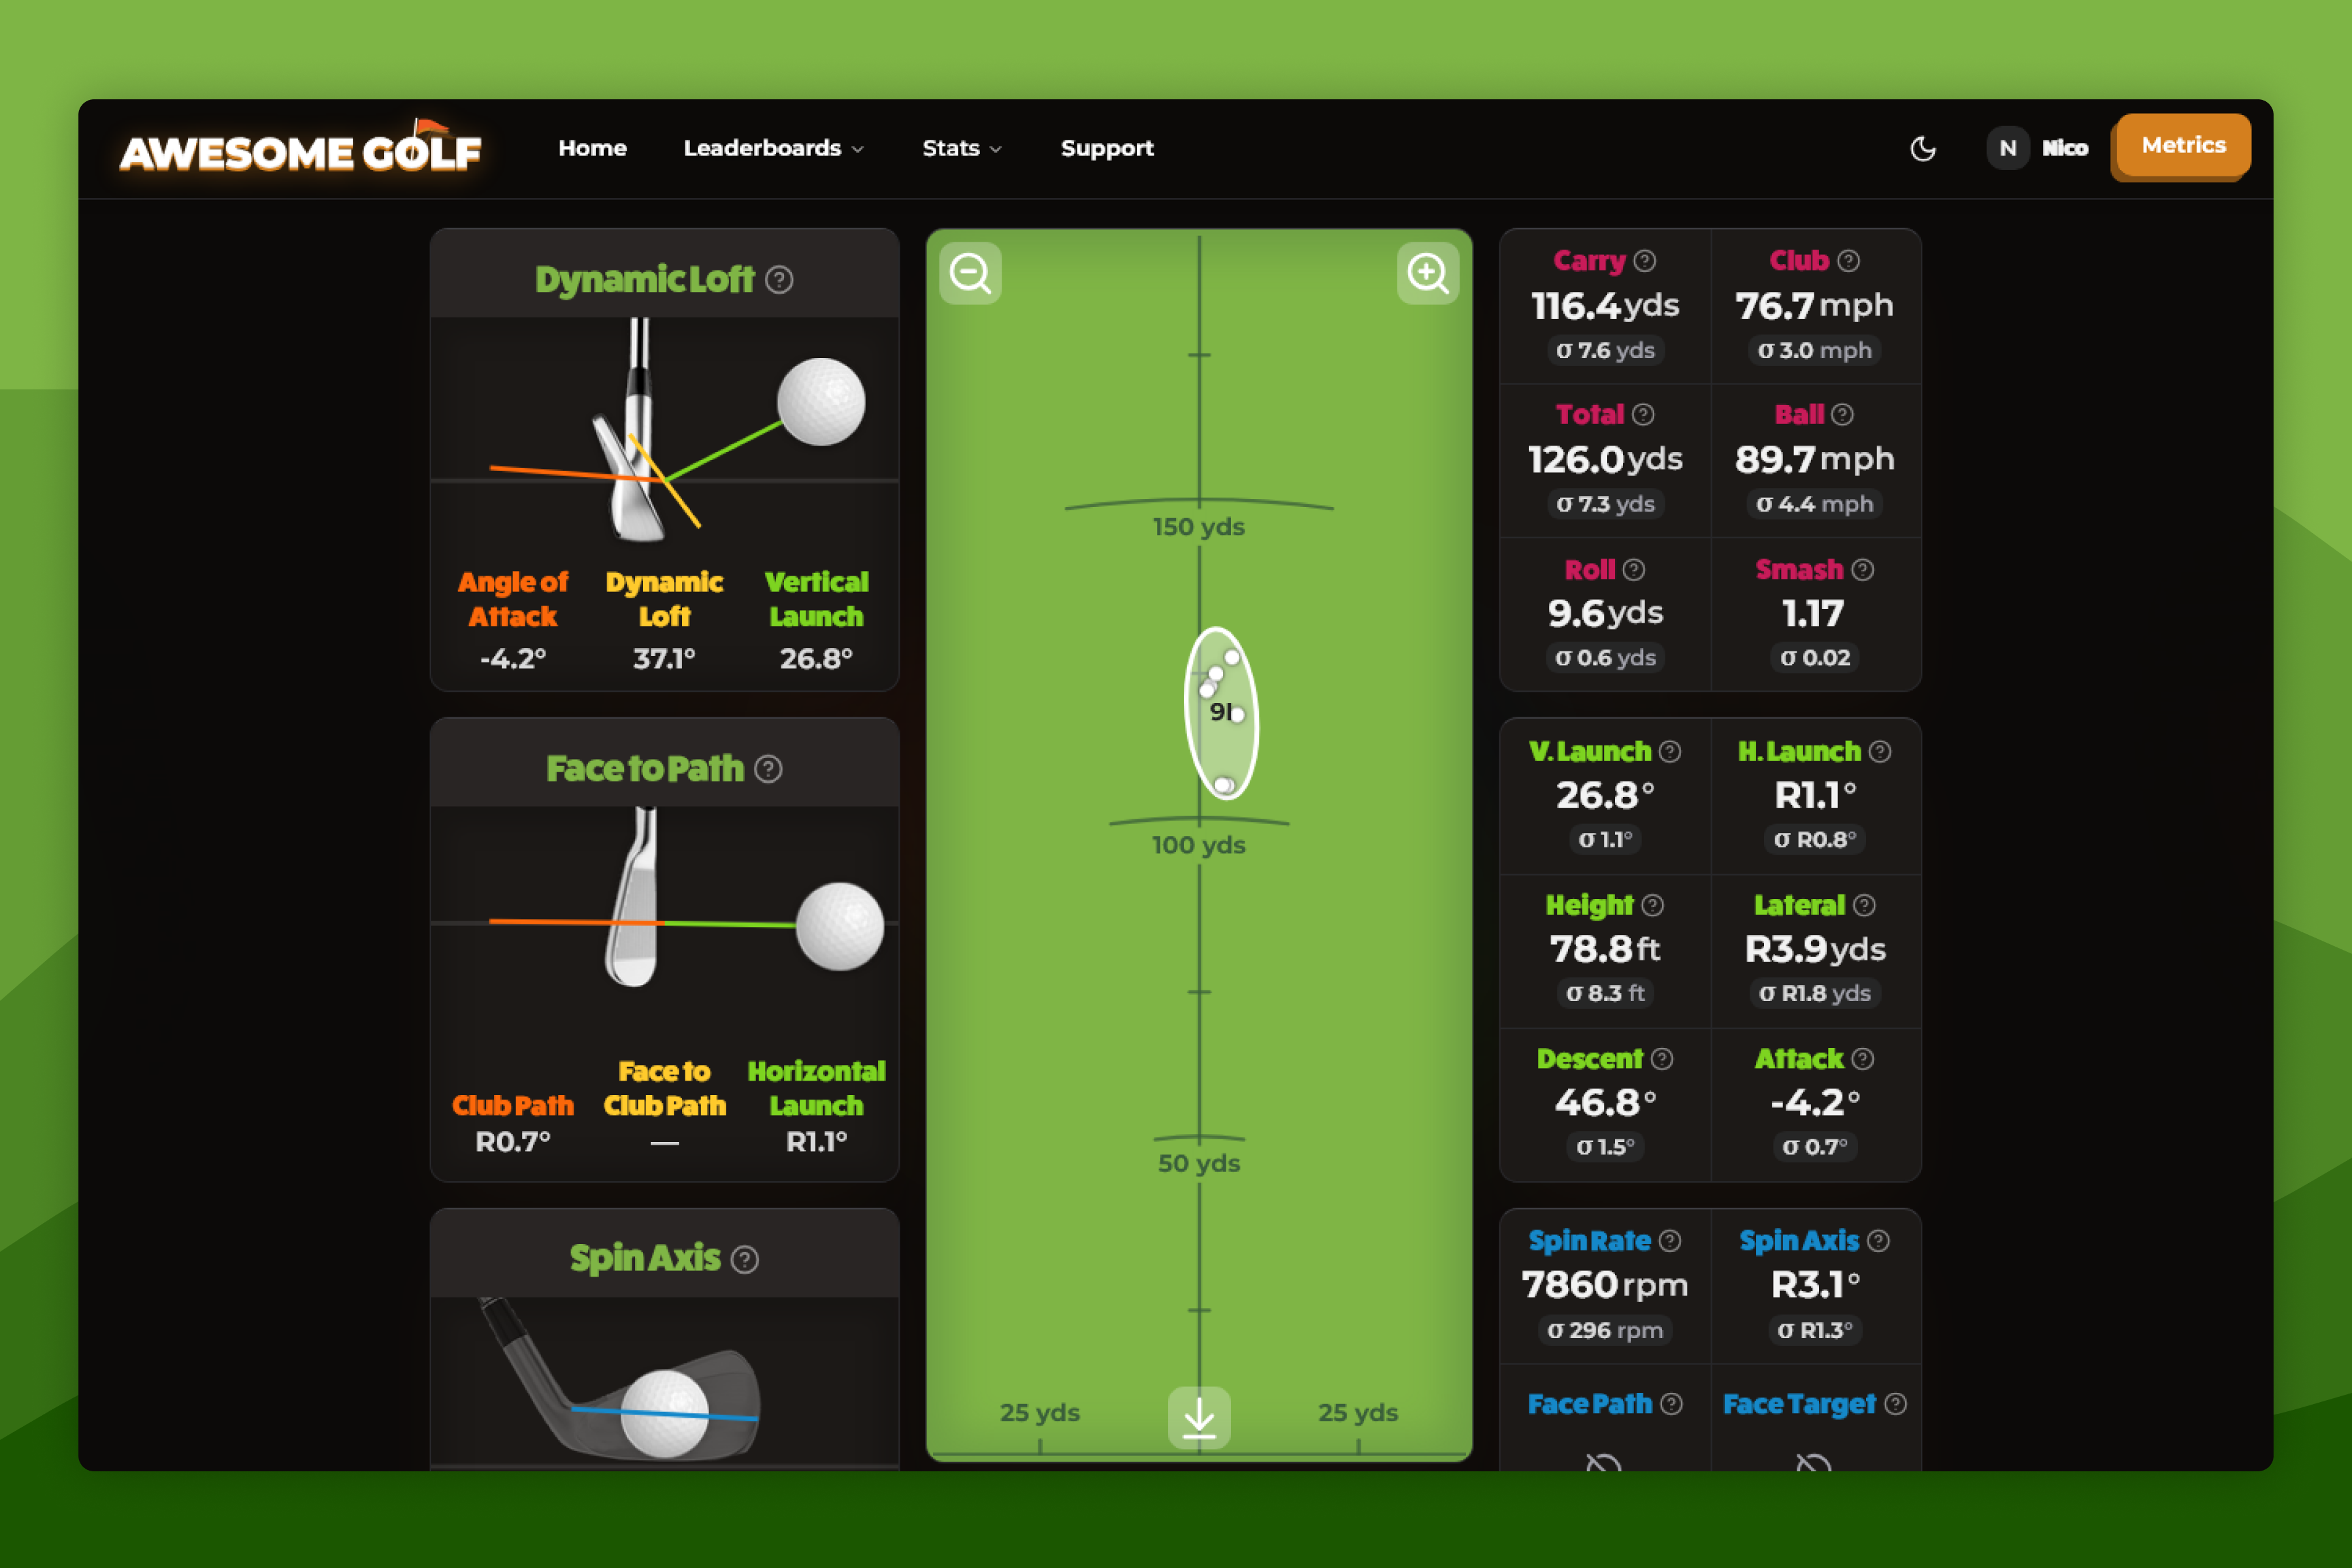
Session Total Averages
Below the Session Shots table, the data points and metrics for the session, or selected shots, are visualised in an outfield graphic with the displayed shots grouped in a circle to show the shots distance, accuracy, and consistency. Alongside the outfield, both the club and ball metrics are displayed, analysed, and visualised, showing both the metric's average and standard deviation for the displayed shots.