How to Review Virtual Golf Rounds with Awesome Golf Insights
Once you've played a round in Virtual Golf in Awesome Golf Simulator, you'll be able to review your stats and performance for the round using Awesome Golf Insights, our online companion tool for reviewing your stats.
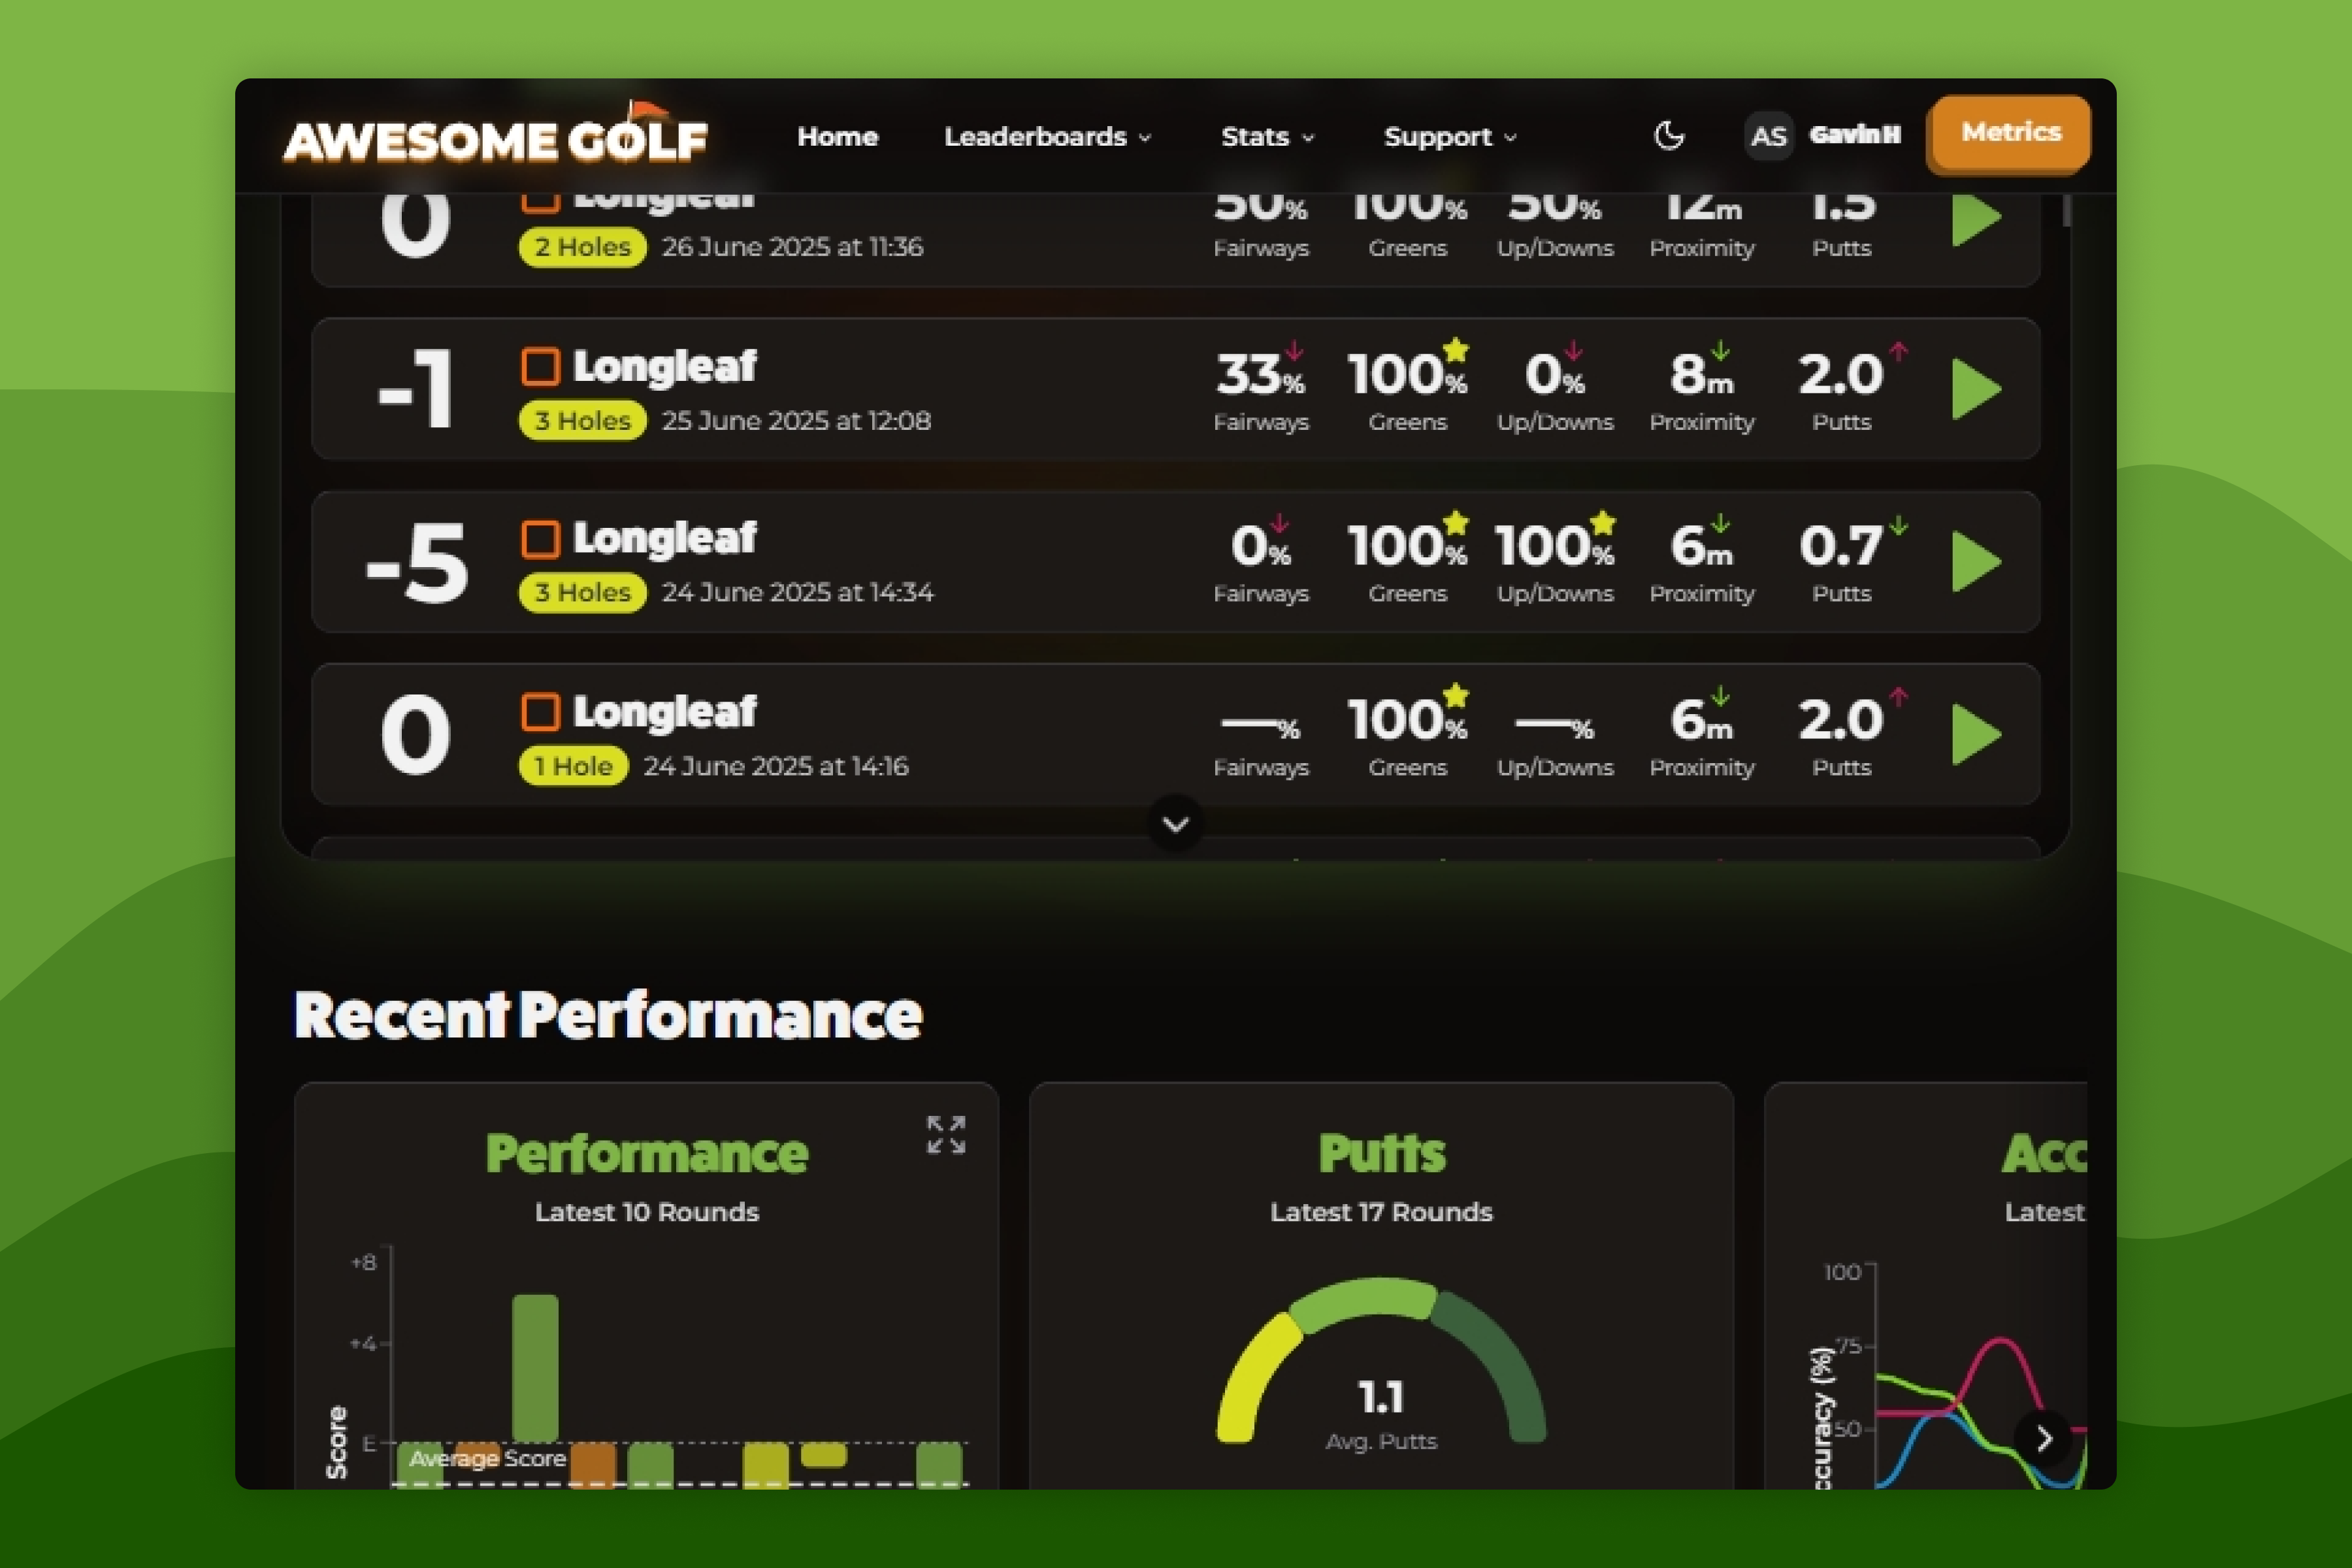
To see a list of your recent Virtual Golf Rounds go to insights.awesome-golf.com/rounds, or select Stats in the navigation bar, then select Rounds in the dropdown dialogues. This list of recent rounds shows an overview of each round's stats, including the date and time of the round, gross score, golf course, tee position, number of holes played, fairways in regulation (%), greens in regulation (%), up and downs (%), approach shot proximity to pin and average number of putts per hole. These featured stats will show trending arrows with green upward-facing arrows or red downward-facing arrows to indicate your performance against your recent average from your last 20 Virtual Golf rounds.
To see more info and stats for a particular Virtual Golf round, select it in the list to expand the round in more detail.
Recent Performance
Beneath the list of recent Virtual Golf Rounds you'll see a breakdown of the data averages for your recent Virtual Golf Rounds and your progress over time.
- The Performance Graph shows your scores against par across your recent 10 rounds in a bar chart format. Each round is represented by an individual bar in the chart where the X-axis represents par and negative bars (below the X-axis) represent a round under par.
- The Putts Graph shows your average number of putts across the last 8 rounds. Below is a count of how many Eagles, Birdies, and Pars, you've made in the last 8 rounds.
- The Accuracy Graph shows three lines which represent fairways hit, greens hit, and up-and-downs. You'll be able to see whether these stats are trending upwards or downwards across your recent 8 rounds.
- The Approach Proximity Graph shows the frequency that you hit your approach shots to within certain distances of the pin based on your latest 8 rounds. Your aim will be to have a higher frequency in the bars, representing the smallest proximity to the pin (towards the bottom).
All Time Stats
The All Time Stats show your averages from all of your Virtual Golf rounds, including average 9-hole score, average 18-hole score, fairways in regulation, greens in regulation, approach proximity, up and down percentage, and average putts per green.
Below this is a visual guide of which scores are most frequent for you from eagles to double bogeys.
Personal Bests
Personal Bests showcase the best moments in 9-hole or 18-hole rounds you've played in Awesome Golf Simulator. These are updated whenever your performance surpasses your previous records. These include lowest score, most eagles, most birdies, most pars, least bogeys, least double-bogeys, lowest putts, most greens hit, most fairways hit, most up-and-downs, lowest proximity, closest approach, and longest shot.
Scorecards
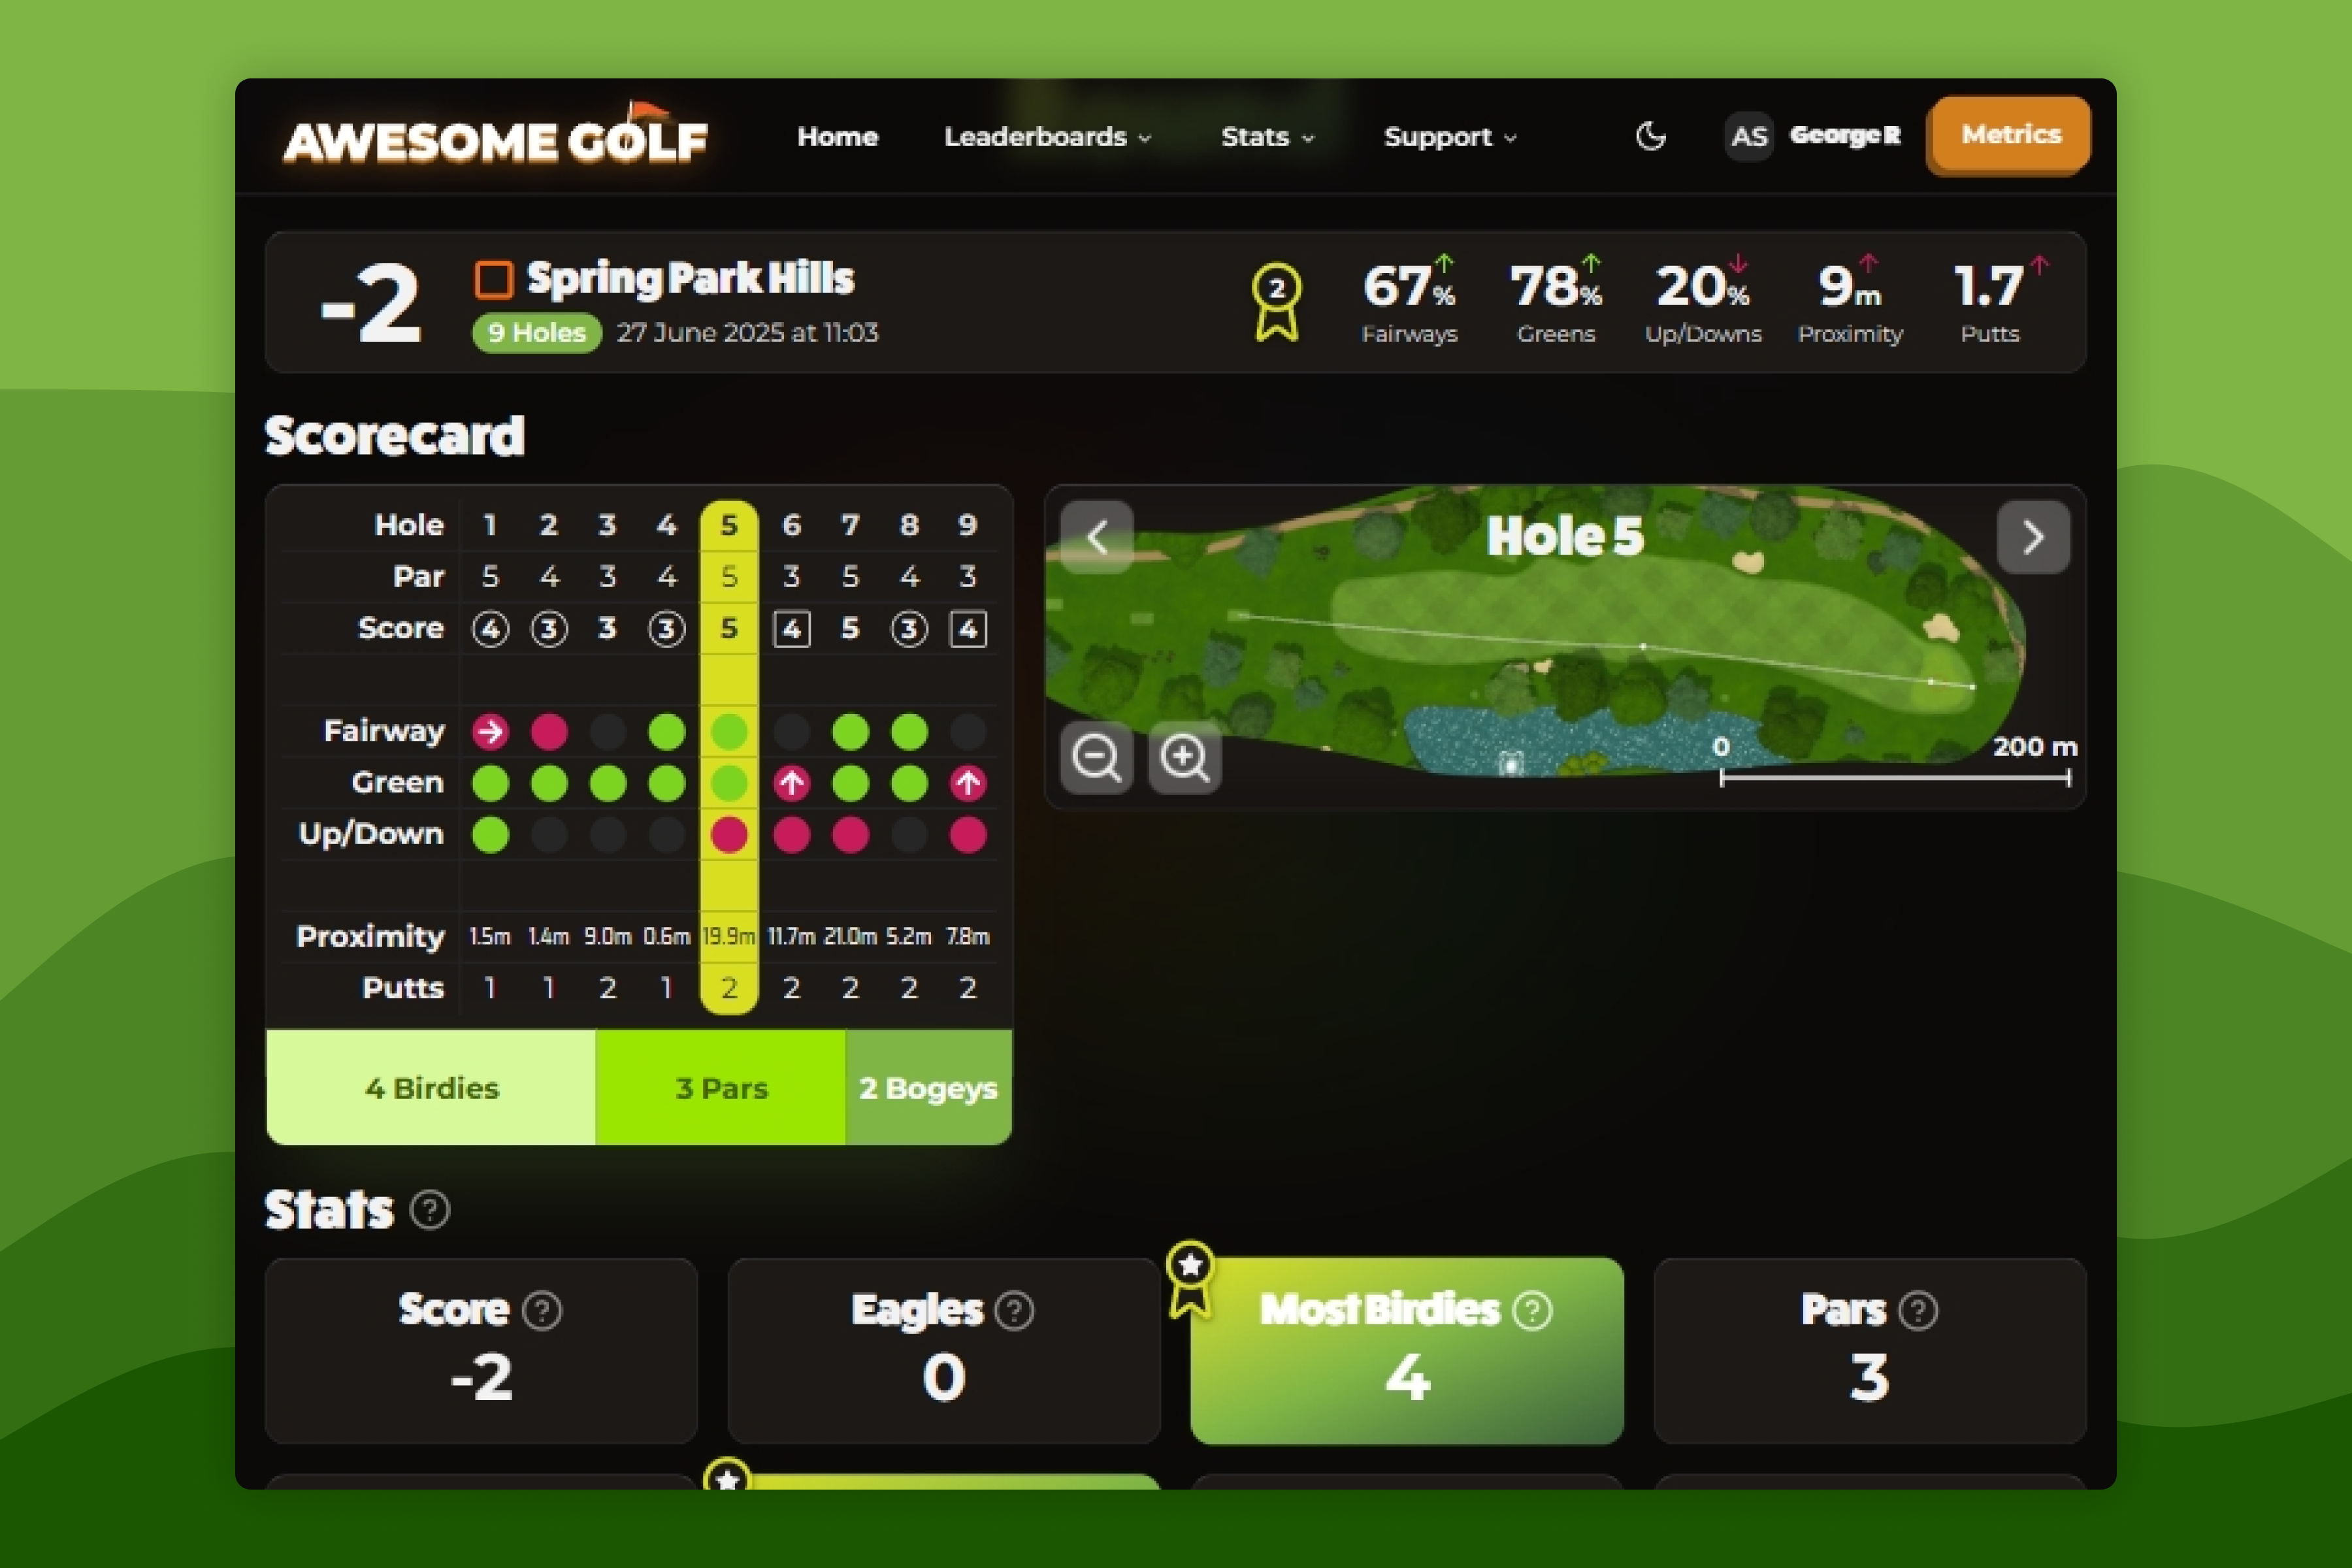
To see more info and stats for a particular Virtual Golf round, select it in the list to expand the round in more detail. This will show you the scorecard for that round.
A round's scorecard page shows your averages for that round, any personal bests achieved, overall stats, and a detailed view of the journey that you took on each hole.
The scorecard shows where your shots finished and allow you to see consistent patterns during your round.
- Fairways will be marked as either hit (green), missed left (red arrow left), missed right (red arrow right) or blank (n/a, e.g. par 3s).
- Greens will also be marked as either hit (green), missed left (red arrow left), missed right (red arrow right), missed long (red arrow up) or missed short (red arrow down).
- Up and downs will be marked as either hit (green), miss (red) or blank.
- The distance between the ball and the hole from an approach shot (shots attempting to hit the green) is recorded as your proximity.
- The number of putts is also recorded for each hole too.
- The scoring frequency is displayed at the bottom of the scorecard showing your most common scores for that round (e.g. 2 Pars, 1 Double Bogey).
On the right-side of the scorecard is an interactive hole map which shows where each shot was hit from and how many shots were hit. You can zoom in/out of this map as well as move it around to see where each shot finished. You can click on the hole you want to view in the scorecard table or the arrows on the hole map to navigate through all the holes played during that round.
To make the most of this data, focus on identifying patterns in your play that influence scoring. For example, if your graphs show that you miss more greens than you hit, you may benefit from improving your approach shot consistency or course management to leave easier recovery shots. Use the proximity and putting statistics to target practice on short game areas where strokes can be saved most quickly. Track whether improvements in accuracy and proximity translate to better scoring trends, and adapt your strategy on the course to play to your strengths while reducing risk in weaker areas. Over time, reviewing and acting on these insights will help you make smarter shot choices and improve your overall scoring performance.