Compare Clubs and Distances with Awesome Golf Insights
Alongside your Awesome Golf Simulator experience, comparing your distances with different clubs is an important way of reviewing your stats and performance to help you improve - and a key analytical tool provided by Awesome Golf Insights.
Awesome Golf Insights provides two different ways of comparing your clubs and distances: Club Comparison, and Club Distances.
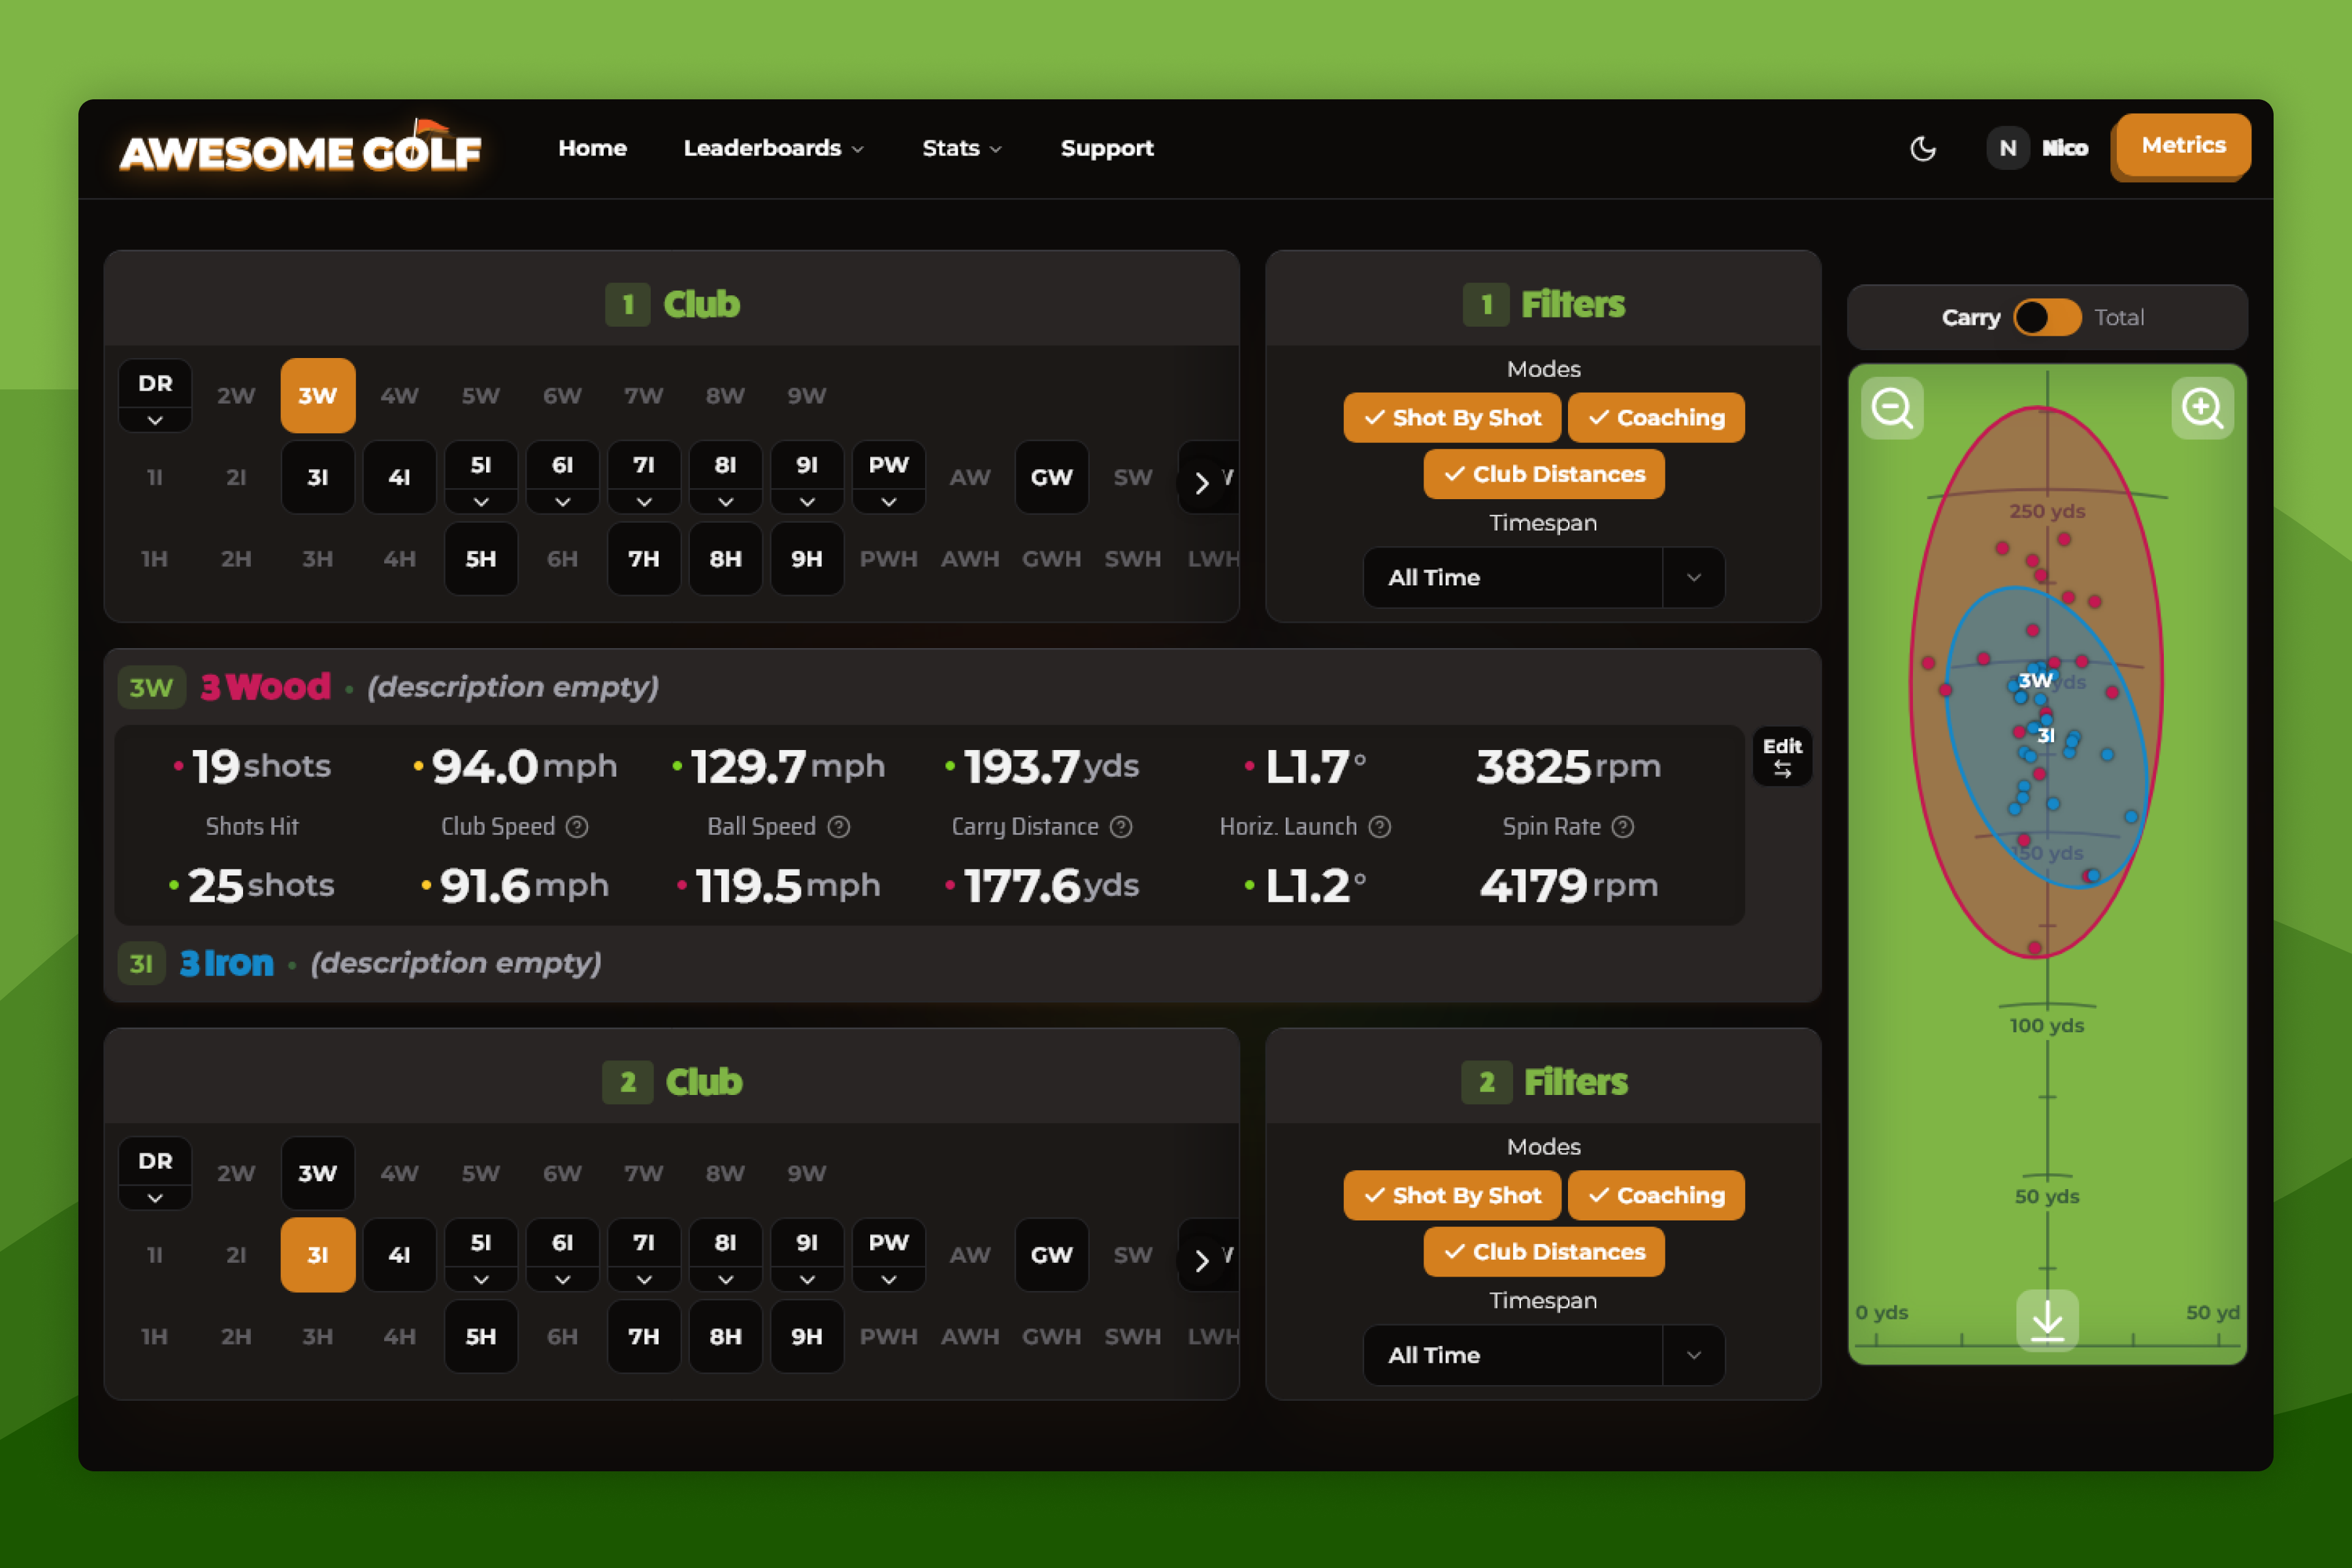
Club Comparison
Club Comparison is a tool for comparing two different clubs to help you select the best club for you, or see your improvement with the same club over time. To find the Club Comparison tool, go to insights.awesome-golf.com/club-comparison, or select Stats in the navigation bar, then select Club Comparison in the dropdown dialogue.
When you have data metrics tracked with a specific club, in Awesome Golf Simulator Shot by Shot, Coaching, or Club Distances, you'll be able to select a club for comparison.
To start, select the two clubs you want to compare - you may need to scroll down to the second club selection section to pick the second club. Clubs with multiple descriptions will show a dropdown (⌄) button to allow a single club description to be selected, individually.
Optionally, filter the selected clubs by Timespan and Game Modes.
Timespan allows you to restrict the analysis to shots within a particular time. For example, in the last year.
Game Modes allows you to select only shots for particular practice game modes for analysis: Shot by Shot, Coaching, or Club Distances.
Outfield Visualisation: This shows the grouping for each selected club, visually, and allows you to instantly see the differences in distances, accuracy, and consistency. Each club is highlighted in red or blue on the visualisation, showing each shot as a point and an oval grouping the shots to show the consistency.
Comparison Table: This shows more raw data and metrics, allowing you to choose and order which data points you're most interested in comparing. By clicking the Edit button in the comparison table, you can scroll horizontally to select which metrics are displayed and drag to reorder them to your preference.
Club Comparison Tips
- Select a Timespan in the Club Comparison filters to compare the same club over time and see how your distance control and dispersion has changed over time. For example, how accurate you were with your sessions with a 9-iron, 3 years ago compared to the last 6 months.
- Compare different Club Characteristics: By adding two of the same club during your practice session and giving them different text descriptions, each can be selected individually for comparison. For example, a driver with two different shafts, irons with two different lengths, or woods with different head weights.
- Compare different Clubs: Descriptions can also be used to differentiate between two different clubs. For example, comparing a 3-wood from Titleist against one from Callaway.
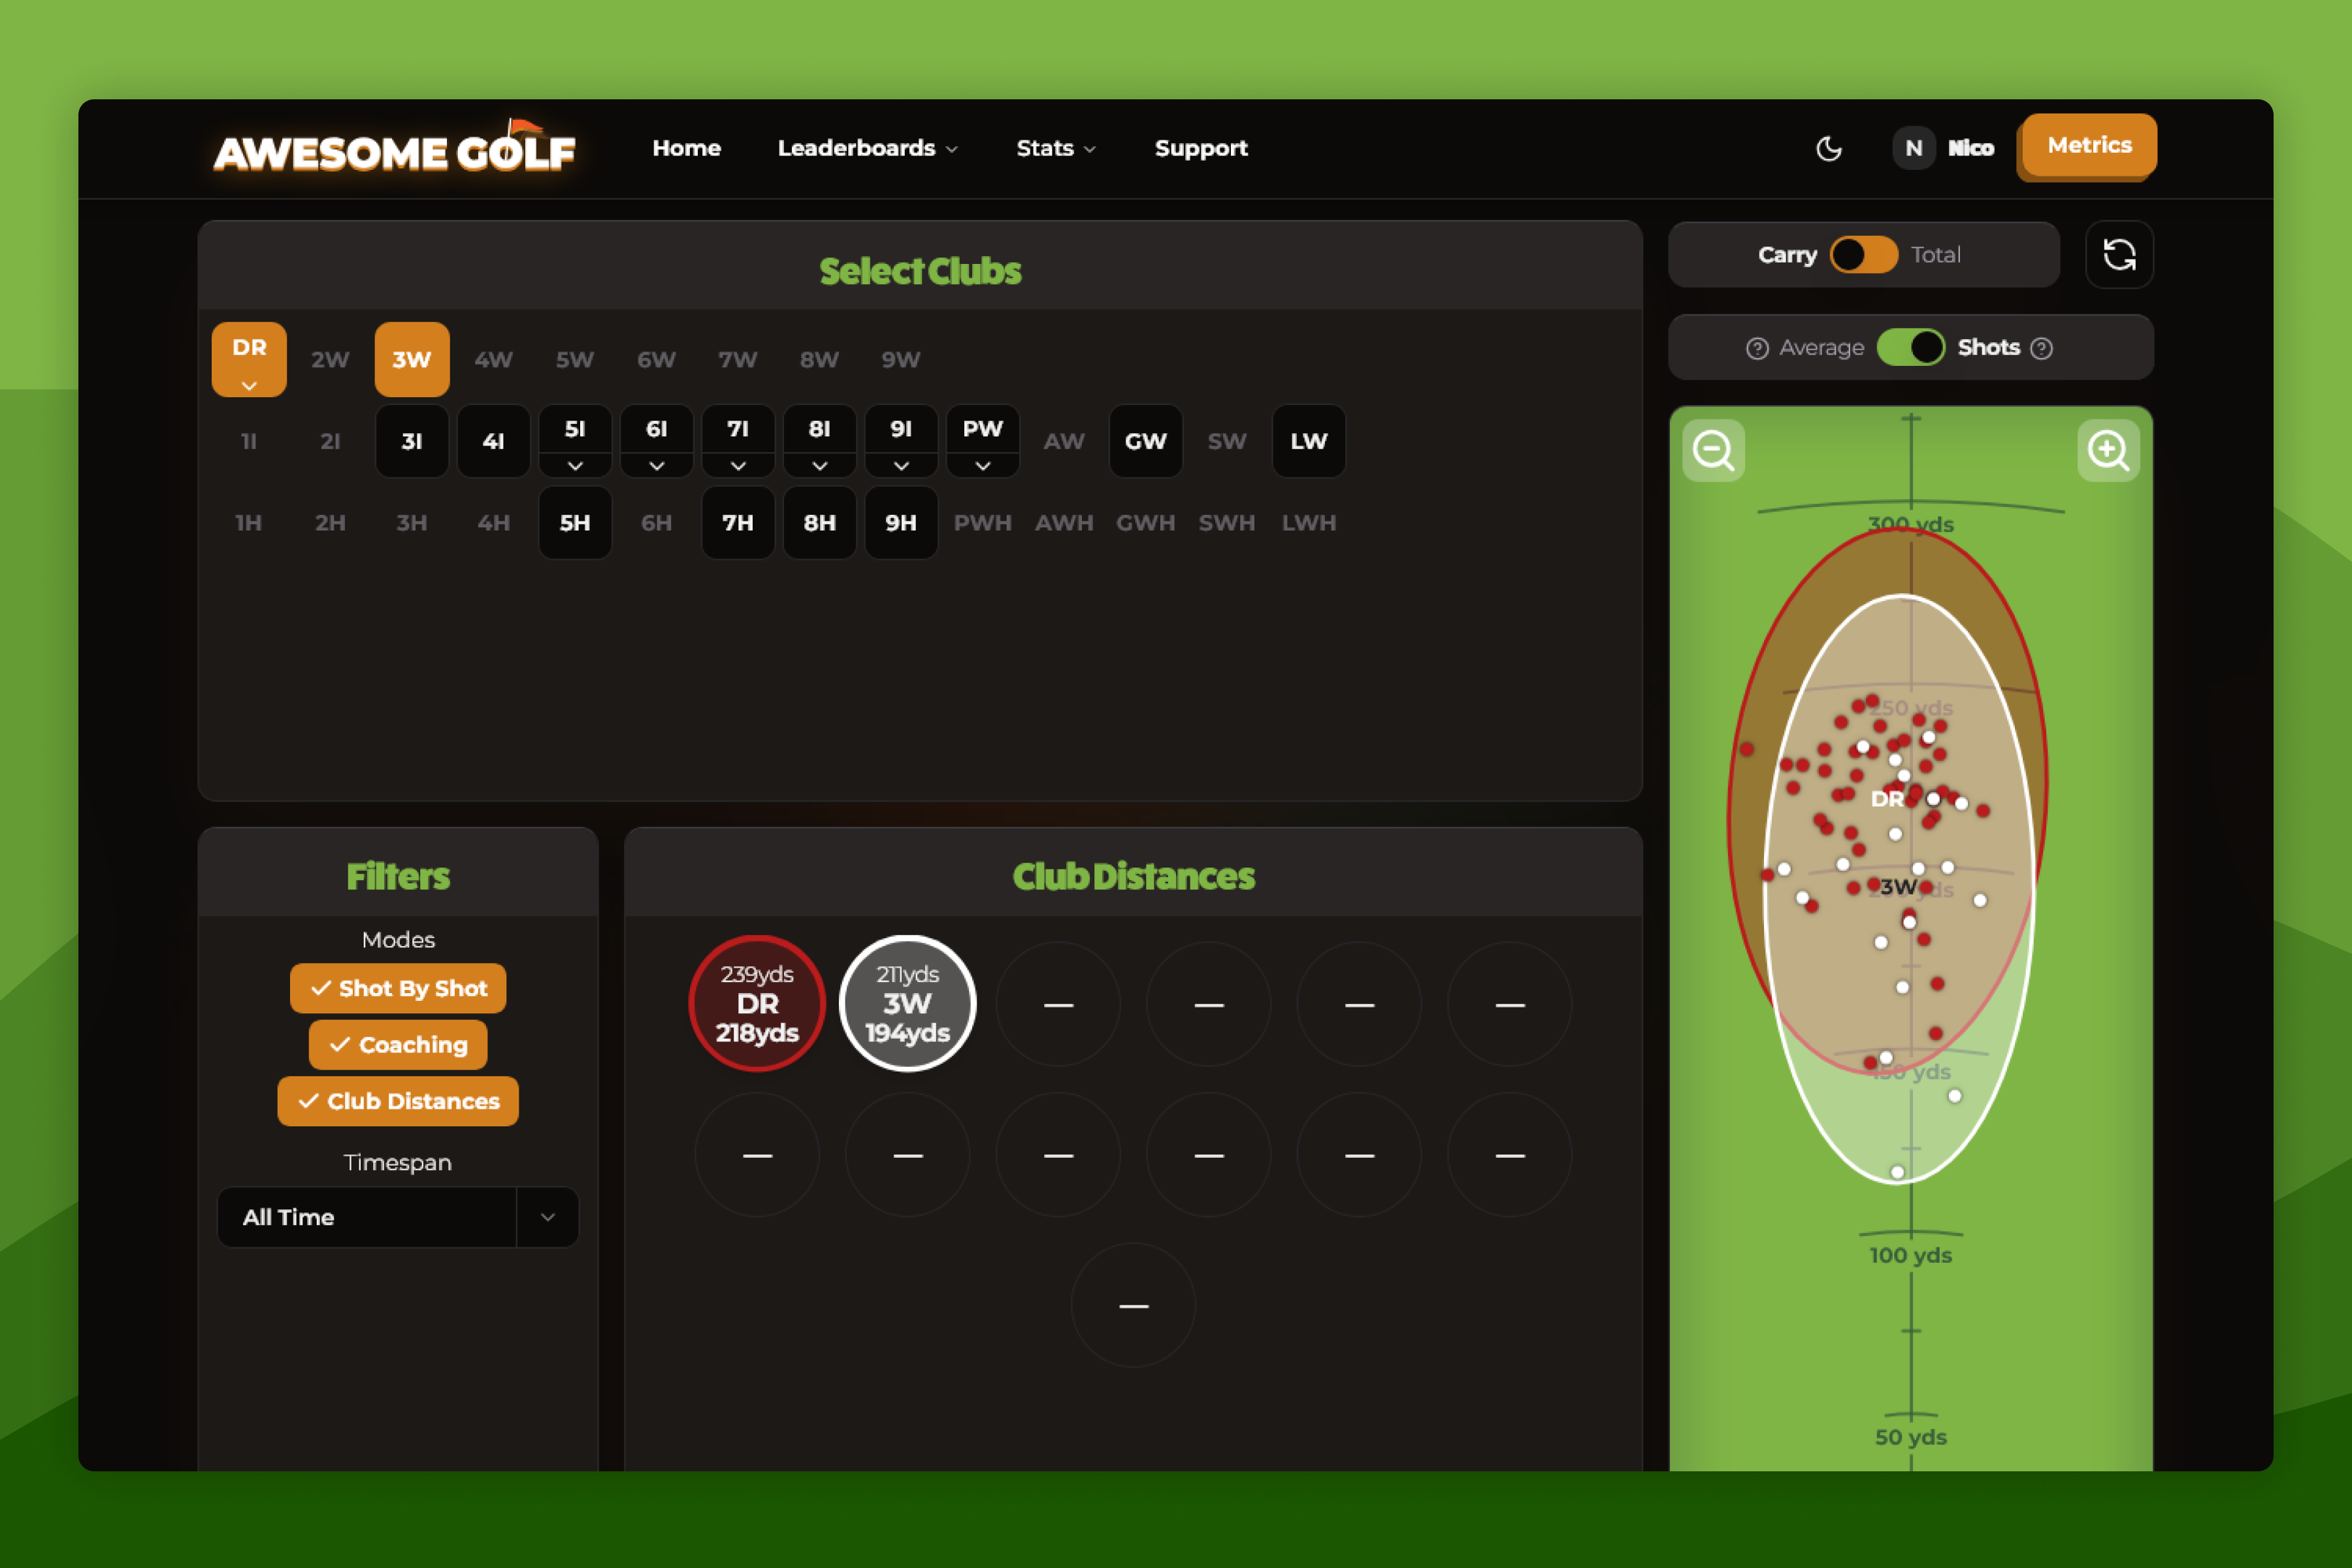
Club Distances
Club Distances is a tool to help you see how far each of your clubs go and identify any unusual distance gaps between clubs. To find the Club Distances tool, go to insights.awesome-golf.com/club-distances, or select Stats in the navigation bar, then select Club Distances in the dropdown dialogue.
When you have data metrics tracked with a specific club, in Awesome Golf Simulator Shot by Shot, Coaching, or Club Distances, you'll be able to select a club for comparison.
To start, select the clubs you want to compare and visualise. Clubs with multiple descriptions will show a dropdown (⌄) button to allow a single club description to be selected.
Optionally, filter the data displayed for the selected clubs by Timespan and Game Modes.
Timespan allows you to restrict the analysis to shots within a particular time. For example, in the last year.
Game Modes allows you to select only shots for particular practice game modes for analysis: Shot by Shot, Coaching, or Club Distances.
Outfield Visualisation: This shows the grouping for each selected club, visually, and allows you to instantly see the differences in distances, accuracy, and consistency.
The selected clubs will be highlighted with a coloured label and two numbers: the average total distance, on the top, and the average carry distance, on the bottom. Switching the Carry / Total toggle will change which of these numbers is highlighted and changes which is used for the shots and groupings on the outfield visualiser.
Additionally, switching the Average / Shots toggle will update the outfield visualiser between displaying the total average of your session data, and a random selection of 50 shots from each club during your sessions. Each club displays on the outfield visualiser in its respective colour and overlaid to show any crossover between club distances. The outfield visualiser can also be zoomed in or out - and can be dragged and scrolled to move around the visualisation.